Understanding the Chart of Accounts
BOS has a fully integrated accounting system. For each Transaction Type, users can select if the transactions must also be posted to the Ledger (affect Accounting).
The Chart of Accounts is divided into two sections:
- Statement of Profit or Loss: Includes Income and Expense accounts. The corresponding report shows the organisation’s profitability.
- Statement of Financial Position: Includes Assets, Liabilities, Investments, and Equity. The corresponding report shows the organisation’s financial worth and solvency.
The Accounting Setup menu includes tabs to setup VAT Types, Currencies, and Credit Terms.
Navigation: Main Menu > Setup > Accounting > Accounts (tab)
The Chart of Accounts (COA) is the foundation of financial tracking in QuickEasy BOS. It is a list of categories that organises your money—where it comes from, where it goes, and what you own or owe. This guide explains how it works in simple terms so you can manage your finances with confidence.
What It Does
The COA groups your financial accounts into a tree-like structure, making it easy to see your business’s money story. It powers two key reports:
- Statement of Profit or Loss: Shows your profit or loss over a period (e.g. revenue and expenses).
- Statement of Financial Position: Shows what you own and owe at a specific moment (e.g. assets and debts).
How it is Organised
Think of the COA as a filing cabinet with folders inside folders:
- Level 1: The top folders are the Statement of Profit or Loss and the Statement of Financial Position.
- Level 2: Inside these are sections like Revenue, Expenses, or Assets.
- Level 3 and Beyond: These hold smaller groups (e.g. Sales) and individual accounts (e.g. Cash) where you record transactions.
Each entry has a parent (except the top level), linking it to the folder above it. For example, Cash might sit under Current Assets, which sits under Assets.
Key Parts Explained
This is how entries are listed in the COA:
- Account ID: A unique number for every entry (e.g. 128 for Finished Goods).
- Parent ID: Shows which entry this one belongs to (e.g. Sales might have Parent ID 69).
- Status: Active (1) means you can use it; Inactive/Archived (0) hides it from lookups.
- Account Type: Tells what kind of money it tracks:
- 1 = Assets (what you own, like cash).
- 2 = Liabilities (what you owe, like loans).
- 3 = Equity (your stake in the business).
- 4 = Revenue (money you earn, like sales).
- 5 = Expenses (money you spend, like rent).
- Report Type: Defines its role in reports:
- 0 = Account (where you post transactions, like cash).
- 1 = Statement of Profit or Loss (top folder for profit/loss).
- 2 = Statement of Financial Position (top folder for assets/debts).
- 3 = Section (e.g. assets or revenue).
- 4 = Group (e.g. office expenses).
- 5 = Summary (e.g. Net Profit or Total Assets).
- Level: Shows how deep it is in the tree (1 = top, 2 = section, etc.).
- Account Code: An optional number like 040101 to identify it (e.g. Sales – Finished Goods).
- Account Name: A clear label (e.g. Rent).
- Order ID: Sets the order within its parent (e.g. 1 for Sales, 2 for Other Income).
- Lookup: An editable description like Expenses – Office – Rent (05052508) for picking accounts in transactions.
How It Works
Adding Accounts
You create accounts in the COA to match your business. For example:
- Statement of Profit or Loss (Level 1)
- Revenue (Level 2)
- Sales (Level 3, Account)
- Revenue (Level 2)
Tracking Money
- Individual Accounts (Report Type 0): You post transactions here (e.g. making a sale increases Sales).
- Groups and Sections: These roll up totals from accounts below them (e.g. Office Expenses sums Rent and Utilities).
- Summaries: Special lines like Net Profit show the final result of sections above them.
Reports
- Statement of Profit or Loss: Uses a date range (e.g. January to December) to show profit:
- Revenue (e.g. Sales) Adds.
- Expenses (e.g. Rent) Subtracts.
- Summaries (e.g. Net Profit) Calculates the difference.
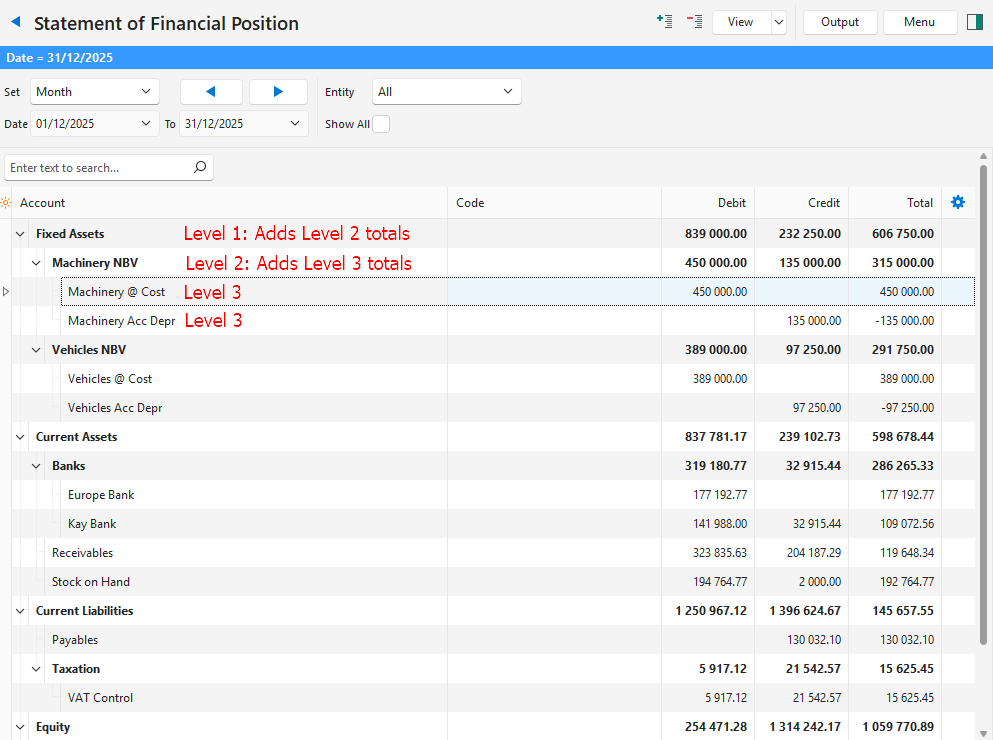
- Statement of Financial Position: Shows totals at one date (e.g. December 31):
- Assets (e.g. Cash) Lists what you own.
- Liabilities (e.g. Payables) Lists debts.
- Equity (e.g. Retained Income) Shows your share.
- Summaries (e.g. Total Assets) Adds up sections.
Tips for Creating Accounts
- Keep It Simple: Use clear names like Cash or Rent and logical groups.
- Set Order: Move the accounts to list items how you want (e.g. Sales before Expenses) and use the alphabetise feature.
- Check Totals: Groups and sections automatically sum their children, so ensure accounts are in the right spot.
- Summaries: Place them after related sections in the order (e.g. Total Assets after Assets).
Example
This is an example of a brief Statement of Financial Position setup: