QuickEasy BOS has incorporated Reportbuilder, a form designer that allows users to customise all their templates (e.g. statements, invoices, emails).
Users have access to the Data Tables and Fields, as well as editing tools to help them design forms.
These tutorials explain how to create templates.
Navigation: Main Menu > Setup > Form Designer > Reportbuilder
Reportbuilder templates may be designed from scratch, copied from an existing template and edited, or created using the form wizard from Reportbuilder > File > New > Report Wizard.
How to Create a Template
A Quotation template is created as an example. The same procedure can be used for all Transaction Types.
You can create multiple Templates for the same Transaction Type.
When an entry is placed, there are two fields: one that contains the label and one that contains the data. You can delete the label field by clicking it and pressing Delete. You can still see a Description of the data field by clicking the field and looking at the row directly below the icons. The name of the table and the field are displayed.
Create a template in QuickEasy BOS so that the name of the form is created either through the Transaction Type or Output Templates module.
Open a list of Quotations.
Note: You cannot create a form if there is no data because the data fields will not be available to input into the form or to preview.
Note: The data fields available on Form Designer are created from the view that is open on the screen in BOS.
Navigate to the Reportbuilder (Main Menu > Setup > Form Designer > Reportbuilder).
Click File > New Report.
Drag the sections (Header, Detail, Footer) down using the dividing grey bars to expand them.
Check if the Data Tree panel is open on your right. If not, add it from Main Menu > View > Toolbars > Data Tree.
A list of the available tables from BOS is displayed on the right. When you click an entry on the Data Tree it opens a list below it that shows all the available fields. (Drag the bar that separates the two panels up or down to resize the panels.)
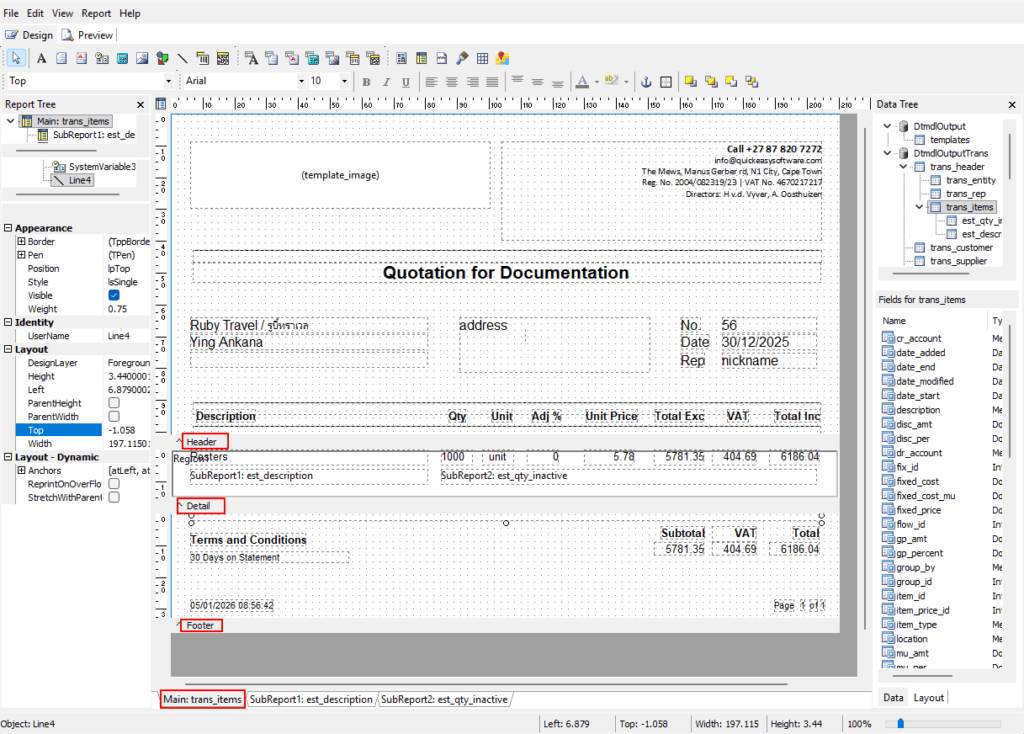
How to Create the Header for Transactions
Entity Information:
Click the entry with information about your entity, named trans_entity under the Data Tree.
On the top row of icons, click DB Image (the icon with the picture) and click inside the header section to place it.
On the left in the Data section, type template_image next to DataField.
Check that the DataPipeline shows trans_entity (directly below DataField). If it does not, overtype the entry with trans_entity.
Use the dots to drag and resize the entry until it is placed where you need it.
On the left under Layout – Dynamic check the checkbox next to Stretch to adjust the logo to fit inside the block.
On the top row of icons, click DBRich Text icon (the icon with the red A) and click inside the header section to place it.
On the left in the Data section, type template_masthead_rtf next to DataField.
Check that the DataPipeline shows trans_entity, else overtype the entry.
If the Header section is too small, drag the bar with the Header label down to increase the Header’s size.
Click the line icon and click the header section just below the placed fields.
Drag the line using the dots until it spans the entire header section.
Press Ctrl S to save your work.
Customer Information:
Click the Label (icon) and click the form to place the label.
Double-click inside the label and type Quotation. Use the text functions above the form to centre the label, make it bold, and to increase the font size.
Click trans_header under Data Tree to access information on the transaction’s header.
Click and drag the following fields into the Header Section:
company_name (inserts the customer’s name).
contact_name (inserts the name of the customer’s contact person).
Click trans_customer under Data Tree.
Click and drag email into the header section.
For each of the added fields:
Delete the labels (first part that shows the name of the field).
Click the field and overtype the following fields in the Layout section:
Height = 5
Left = 6
Width = 75
Drag the fields to space them vertically which sets the top margin.
Click trans_header under Data Tree.
Click and drag address into the header, next to the company name.
Document Information:
Next to the address, create labels for:
Number (QT No.)
Date
Rep
Click trans_header under the Data Tree.
Drag trans_no from the Fields section next to the text Number.
Drag date_trans from the Fields section next to the text Date.
Click trans_rep and drag nickname from the Fields section next to the text Rep.
For each of the added fields, adjust the layout as described in Step 2g.
Labels:
Insert a horizontal line below the previous entries (click the line icon and drag the line to span the page).
Insert labels just below the line and above the section break for the following fields:
Description
Qty
Unit
Adj % (Include this field only if the adjustment is negative (a discount) that you want to make the customer aware of.)
Unit Price
Total (Exc)
VAT
Total (Inc)
Change the labels’ appearance and size (e.g. bold, 10 pts).
Insert another line below the labels.
Press Ctrl S to save your work.
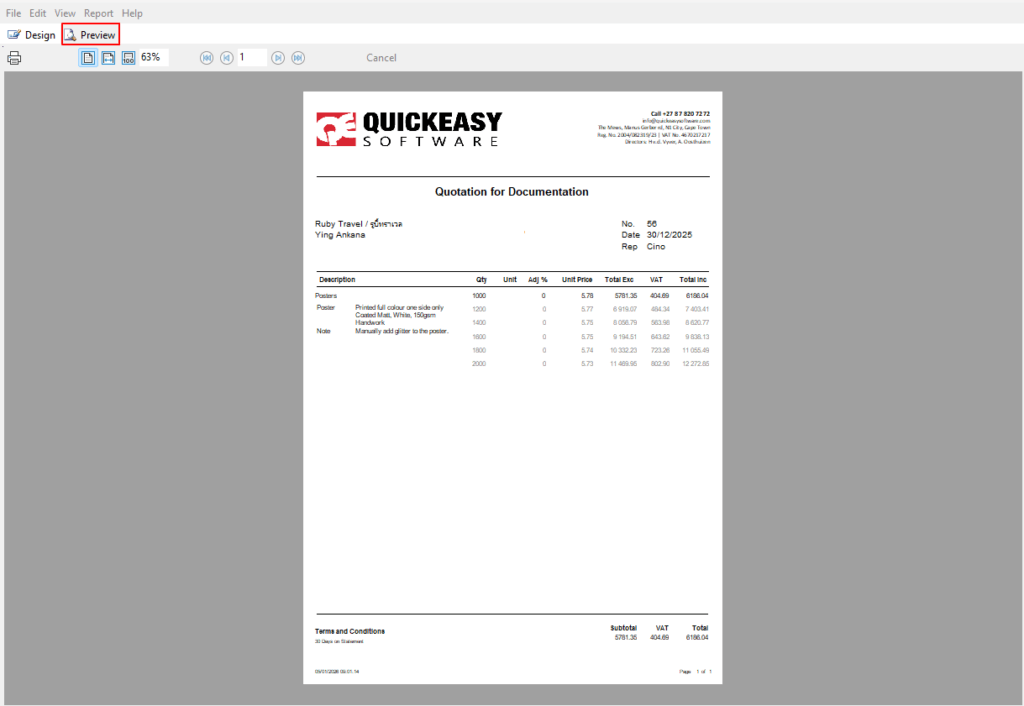
Click Preview (tab) to see what the layout looks like. Adjust as needed.
How to Create the Detail Section
Click the icon next to Report Tree to switch the left-side panel to Report View.
In the block on the left that shows Data select trans_items from the dropdown list next to DataPipeline.
Click the Region (icon) (6th icon from the right) and click the detail section.
Under Appearance click the plus sign next to Pen.
Change the Style to psClear.
Under Layout check the checkboxes next to ParentWidth and ParentHeight.
Under Layout – Dynamic check KeepTogether.
Note: The region block helps to keep the data together and will insert a new page if there are too many transactions.
Click trans_items on the Data Tree and drag the following fields into the region block below where the headings were created:
description
qty
unit
disc_per (adjustment percentage: Adj %)
total_unit_cur (This field is the total unit price in the transaction’s currency.)
total_cur (This field is the total due, excluding VAT in the transaction’s currency.)
vat_cur (This field is the VAT amount.)
total_vat_cur (Total due including VAT in the transaction’s currency.)
Align the added fields using the icons on the font section. The totals should be aligned right.
Change the font size and colour (e.g. black 10 pts) using the options on the font section.
Press Ctrl S to save your work.
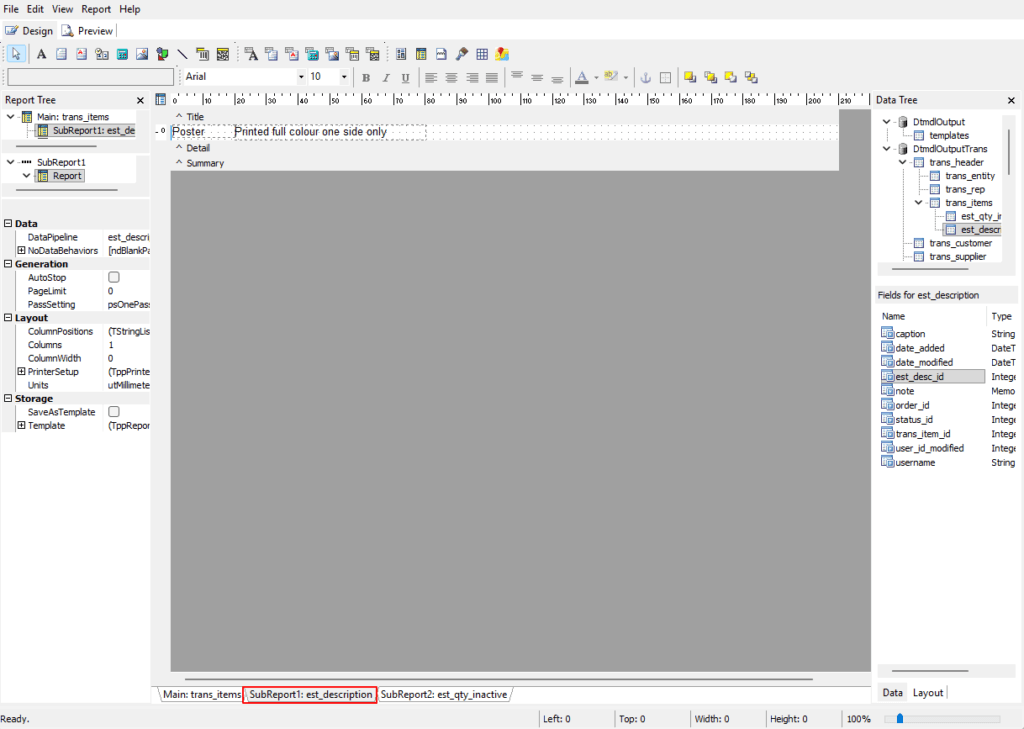
Add a sub report (inside the region) to show the full Estimate Description as follows:
Click the SubReport icon (yellow icon 5th from the right).
Next to DataPipeline select est_description.
Uncheck the checkbox next to ParentWidth.
Type the width to match the width of the description (e.g. 75).
Align the sub report with the description.
Click the tab at the bottom that shows SubReport1: est_description.
Drag these fields into the Detail section:
caption
note
Align the fields next to each other. Look at the margin bar and check that the fields end where the description ends on the main report (Main: trans_items).
Adjust the font and alignment as needed.
For the Note field below Layout – Dynamic, check the checkbox next to Stretch. This step expands the block to fit the full description.
Press Ctrl S to save your work.
Click the tab Main: trans_items to return to the main report.
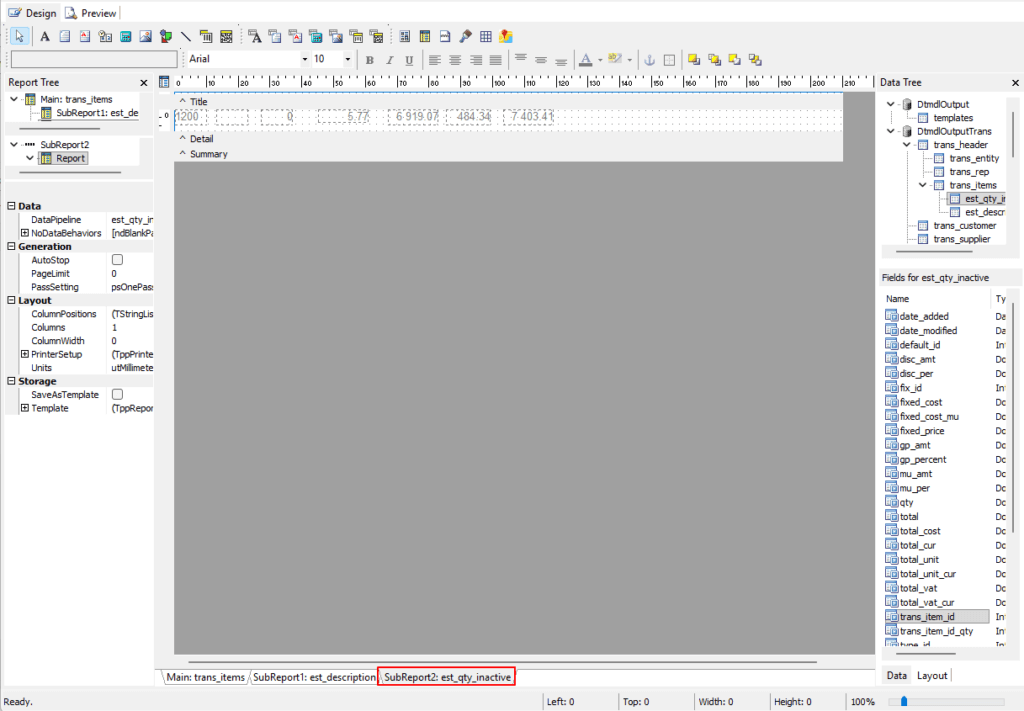
Add a sub report to show inactive quantities as follows:
Click the SubReport (icon) (5th from the right) and click the region block to add it.
Select est_qty_inactive as the DataPipeline.
Click the tab at the bottom that shows SubReport2: est_qty_inactive
Drag the same fields as mentioned in Step 7b-h from est_qty_inactive and place them aligned with the fields matching their names.
Write down the left margin and width of each field to help you align them.
Place them on the right until they are all placed.
Hold down the shift key and click on all the fields to select them.
Move them to the left so they start where SupReport2 starts. (SubReport2 starts under the Qty column on the main design – see the screenshot.)
Change the font, text colour (grey) and alignment of the fields.
For each of the number fields click the three ellipses next to DisplayFormat under Text. Select the second option from the dropdown list.
Click the tab Main: trans_items to return to the main report.
Press Ctrl S to save your work.
Click Preview (tab) to check that the report is generated correctly.
How to Create the Footer
Insert a horizontal line on the first line of the footer (click the line icon, click the footer, and drag the line to span the page).
Click the label icon (the large black A).
Click inside the footer section to place the label and drag it to the left.
Double-click the placed label and change the text to Terms & Conditions.
Click trans_header on the Data Tree and drag credit_term from the fields below the label you created in Step 2. Resize the field to allow for a block of text if you have complicated terms.
Delete the label name (optional).
Create labels for the following fields and align them on the right below the respective fields in the detail section:
Subtotal
VAT
Total
Click trans_header on the Data Tree:
Drag the field total_cur below the text Subtotal.
Drag the field vat_cur below the text VAT.
Drag the field total_vat_cur below the field Total.
For each of these fields, in the Text section on the left click the ellipses next to DisplayFormat and select the second option (which uses 2 decimal places).
Press Ctrl S to save your work.
Click the icon System Variables (5th icon from the left).
Click the form to place it.
Select one of the options (e.g. date, time, page number) on the dropdown list, which is just below the row of icons and shows Date at first.
Add more System Variables if needed. For example, place the date and time below the terms and conditions so you have a record of when the quotation was generated. Place the page number and page count on the right. Insert labels if needed (e.g. Page (label), page number (variable), of (label), page count (variable)).
In the Layout block on the left: Adjust all the fields to be aligned and where applicable have the same width and height.
Note: If the layout block is not there, you are still in Report View. Click any field on the table to switch back to Layout View.
Press Ctrl S to save.
Reportbuilder FieldsReportbuilder Sub ReportReportbuilder Sub ReportReportbuilder Preview
Tips
If the preview does not display anything, go to a transaction and output the report. Close the output and return to Reportbuilder. This step tends to trigger the preview.
Drag fields anywhere onto the relevant section and use the layout block on the left to type the actual coordinates, instead of trying to visually position and align the fields. This method also helps you coordinate the heights and widths of fields.
After dragging a field onto a section, click anywhere else in that section. This breaks the label and field into two parts which makes it easier to then delete the label part.
Instead of double-clicking labels, you can also enter the caption in the Text section on the left.
To start over, simply create a new form and save it over the existing form.
How to Copy a Template
Copying a template is easier than creating a new template from scratch because most of the fields are already there; you only need to edit them.
Copying forms also ensures consistency because all the layouts follow the same pattern (e.g. logo on the left, address on the right).
Create a template in BOS so that the name of the form is created either through the Transaction Type or Output Templates module.
Open a Transaction list (e.g. Main Menu > Workflow > Quotations).
Note: You cannot create a form before entering data, because the fields are only created as data is input.
Note: The data fields available on Form Designer are created from the view that is open on screen.
Click Main Menu > File > Open and select a template from the list. (Or Main Menu > File > Load From File to open a report created elsewhere.)
Click Open (button).
If you receive the message Error Reading Template, click Ignore All and relink the template once it is loaded.
Save the template before changing it: click Main Menu > File > Save As and select an option on the list (the name you created in Step 1), click Save (button).
Make any changes as needed:
Add fields as required.
Click a field and press Delete on your keyboard to remove it.
Click a field and drag it to reposition it.
Click a field and use the dots to resize it.
Double click a text field to change the text.
Remember to save your work often because there is no auto-save feature (press Ctrl S).
How to Relink a Template
When you receive a message Error Reading Template, it often means that the template is looking for data fields that are not in your current version of QuickEasy BOS. It mostly happens when you import a template from another database.
In that case, you must relink the fields to your current data fields.
Click the field you want to change.
At the top (below the icon row), the list of fields is opened.
From the dropdown list in the first block, select the Data Table.
From the dropdown list in the second block, select the Field.
Repeat Steps 1-2 until all the fields are relinked.
Save the form (Main Menu > File > Save or Ctrl S).
How to Change the Print Setup
Click the icon next to Report Tree to switch the left-side panel to Report View.
In the Layout (tab) on the left, click the + next to PrinterSetup to expand the view.
Select the printer next to PrinterName from the dropdown list of all the printers you have installed.
Change any of the other settings, as necessary.
Click Main Menu > File > Save.
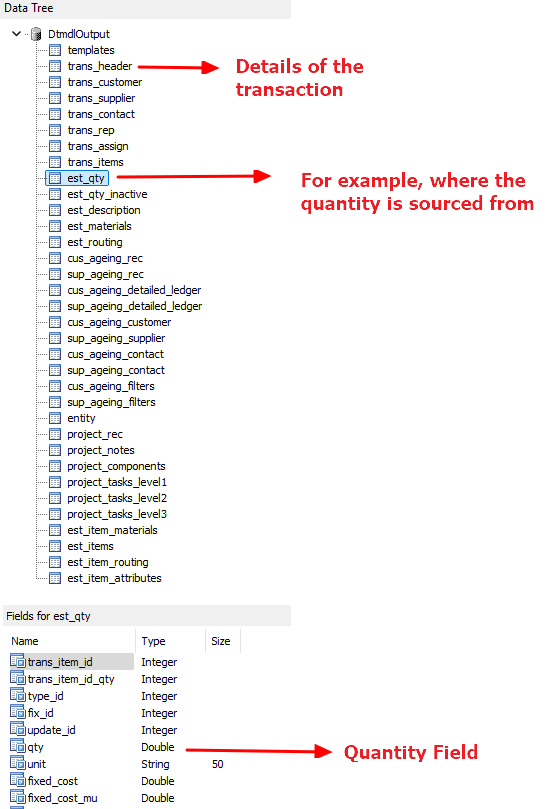
About Data Pipelines
All the data is in DtmdlOutput.
Each field under DtmdlOutput consists of multiple sub-fields.
If you click a field, the sub-fields are displayed in an expanded tree view or in the block below (depending on your settings).
Each sub-field is linked to its parent field.
You cannot use a sub-field without including the parent field because the form must know where to fetch the data from (it needs the link).
This rule also applies to sub-fields of sub-fields.
For example, if you want to display quantities, you need to include the header (trans_header) to indicate where the quantities source from (e.g. Quotation) and the sub-field that contains the quantity (e.g. est_qty) before you can display the quantity (qty).
The information must be inserted into the form using DBText or DBMemo fields. (Do not use rich-text fields to access these pipelines because rich-text fields do not create the necessary links).
To provide the best experiences, we use technologies like cookies to store and/or access device information. Consenting to these technologies will allow us to process data such as browsing behavior or unique IDs on this site. Not consenting or withdrawing consent, may adversely affect certain features and functions.
Functional
Always active
The technical storage or access is strictly necessary for the legitimate purpose of enabling the use of a specific service explicitly requested by the subscriber or user, or for the sole purpose of carrying out the transmission of a communication over an electronic communications network.
Preferences
The technical storage or access is necessary for the legitimate purpose of storing preferences that are not requested by the subscriber or user.
Statistics
The technical storage or access that is used exclusively for statistical purposes.The technical storage or access that is used exclusively for anonymous statistical purposes. Without a subpoena, voluntary compliance on the part of your Internet Service Provider, or additional records from a third party, information stored or retrieved for this purpose alone cannot usually be used to identify you.
Marketing
The technical storage or access is required to create user profiles to send advertising, or to track the user on a website or across several websites for similar marketing purposes.