Dashboard Interface (KPIs) BOS Desktop
- Performance indicators are selected and set up from QuickEasy BOS desktop.
- Indicators are created and customised per user.
- These indicators are displayed on the Dashboard of the mobile app.
Dashboard / Indicator List View
Navigation: Main Menu > Setup > Users > Right-click a Username > View/Edit Dashboard
Buttons Explained
| Button | Description |
|---|---|
| ↑ ↓ | Navigates to the next or previous user’s dashboard. |
| Refresh | Refreshes the display. |
| New | Creates a new indicator as selected on the dropdown list. The options are: – Sales Pipeline: Displays selected transaction-type totals. – Production Loading: Displays work orders per entity. – Delivery Schedule: Displays sales orders per due or required date. – Quotation Summary: Displays quotations grouped by category or rep. – Sales Summary: Displays customer invoices grouped by category or rep. – Order Summary: Displays sales orders grouped by category or rep. – Ageing Summary: Displays the customer-and-supplier-age-analyses totals per entity. |
| Import | Allows you to import an indicator from a different user. |
| Menu | Show Notes: Toggles showing or hiding notes. Layout |
Fields Explained
| Field | Description |
|---|---|
| Field Chooser (*) | Allows users to add or remove columns. |
| ID | The system-generated number for the entry. |
| User | The name of the user. |
| OrderID | The system-generated number for the order of the entry. |
| Type | The type of indicator. |
| Filters | The selected filter for the indicator. |
| Created | The date on which the entry was created. |
| Updated | The date on which the entry was updated. |
| Updated By | The User who last updated the entry. |
| Widget | A submenu, which can also be accessed by right clicking the entry, with the following functions: – Edit Indicator: Allows users to edit the indicator. – Copy Indicator: Copies the indicator to create a new one. – Move Up Ctrl+U: Moves the indicator one line higher. – Move Down Ctrl+D: Moves the indicator one line lower. – Delete Indicator Ctrl+Del: Deletes the indicator. |
Dashboard / Indicator Edit View
Navigation: From Dashboard List View, right click an entry and select Edit Indicator from the context menu.
Buttons Explained
| Button | Description |
|---|---|
| ↑ ↓ | Navigates to the next or previous indicator. |
| Edit | Allows the entries in the Value column to be edited. |
| New | Creates a new indicator. |
| Save | Saves any changes. If the button is greyed out, all the changes have been saved. |
| Copy | Copies the indicator. |
| Delete | Deletes the indicator. |
Fields Explained
- Fields are divided into
- Transactions: Allows users to select the transactions to include.
- Filters: Allows users to specify how the indicators should be filtered (e.g. by Rep or by Category). Indicators can be copied to display them with different filter options.
| Field | Description |
|---|---|
| Field Chooser (*) | Allows users to add or remove columns. |
| ID | The system-generated number for the entry. |
| Attributes | Divided into two sections: Transactions and Filters. Displays the name of the indicator and the available options. |
| Value | An editable field which contains dropdown lists to select values for the attributes and filters. |
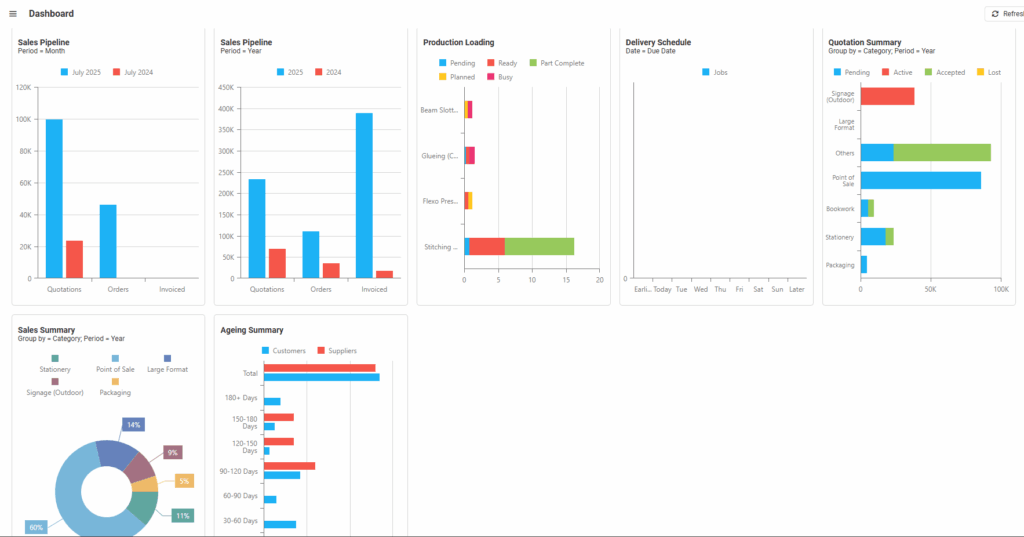
Available Indicators
- Indicators refer to the visual representation of data.
- Each indicator its own filters.
- An indicator can be included for each filter (e.g. Sales Pipeline per Month, Sales Pipeline per Year).
Below is an example of the mobile app’s dashboard when viewed from a desktop computer.
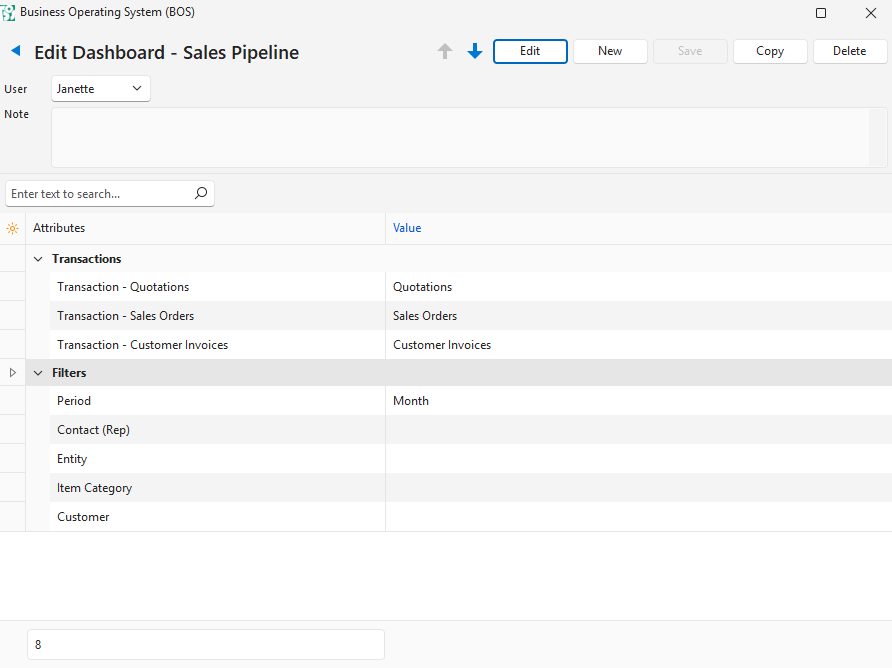
Sales Pipeline
- The Sales Pipeline displays a visual representation of current, forthcoming, and potential sales for the selected period.
Attributes
| Attributes | Description |
|---|---|
| Transactions – Quotations | A dropdown list of all the created Transaction Types for users to select the one they use for quotations. |
| Transactions – Sales Orders | A dropdown list of all the created Transaction Types for users to select the one they use for sales orders. |
| Transactions – Customer Invoices | A dropdown list of all the created Transaction Types for users to select the one they use for customer invoices. |
Filters
| Filters | Description |
|---|---|
| Period | Option to select Month or Year as the period. – Month: Columns display the current and previous month’s totals side-by-side. – Year: Columns display the current and previous year’s totals side-by-side. |
| Contact (Rep) | Option to select a Rep or Operator from a dropdown list. Can be left blank to include all reps and operators. |
| Entity | Option to select a Registered Entity from a dropdown list. Can be left blank to include all the registered entities. |
| Item Category | Option to select an Item Category from a dropdown list. Can be left blank to include all item categories. |
| Customer | Option to select a Customer from a dropdown list. Can be left blank to include all the customers. |
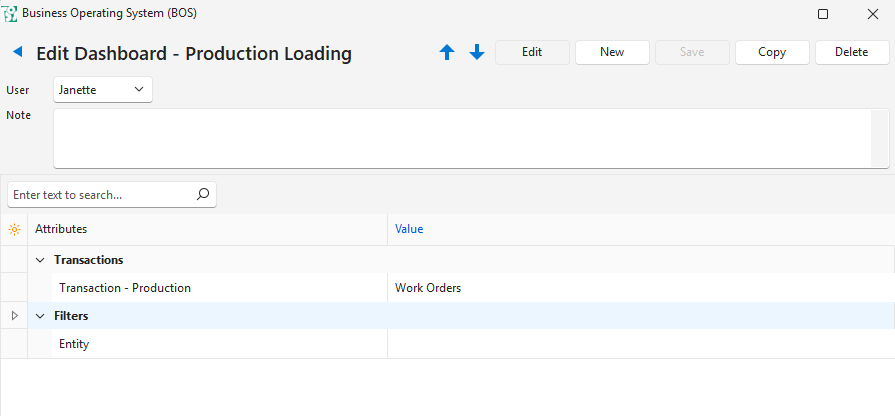
Production Loading
- Production Loading provides a visual representation of the number of goods currently in production.
- Production is delineated by status (e.g. pending, ready, busy).
Attributes
| Attributes | Description |
|---|---|
| Transaction – Production | A dropdown list of all the created Transaction Types for users to select the one they use for production (e.g. work orders). |
Filters
| Filters | Description |
|---|---|
| Entity | Option to select a Registered Entity from a dropdown list. Can be left blank to include all the registered entities. |
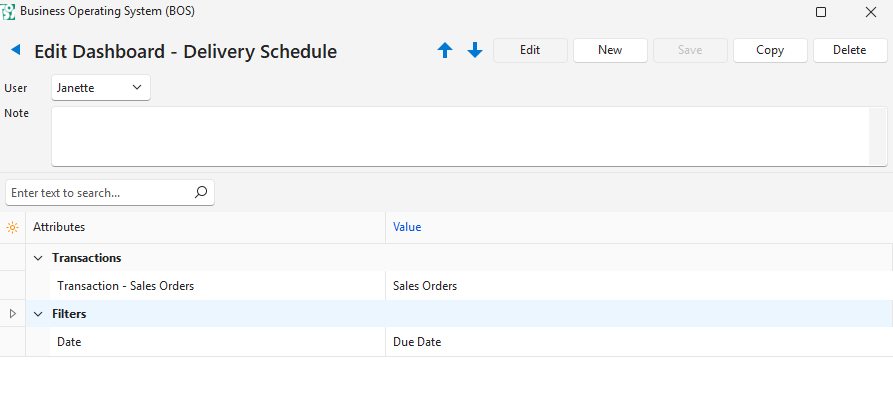
Delivery Schedule
- The Delivery Schedule provides a visual representation of the jobs that are due this week.
Attributes
| Attributes | Description |
|---|---|
| Transaction – Sales Orders | A dropdown list of all the created Transaction Types for users to select the one they use for sales orders. |
Filters
| Filters | Description |
|---|---|
| Date | Options to select Due or Required Dates. – Due Date: Typically used to indicate the date by which production should be finished. – Required Dates: Typically used to indicate the date by which a customer requires the product. |
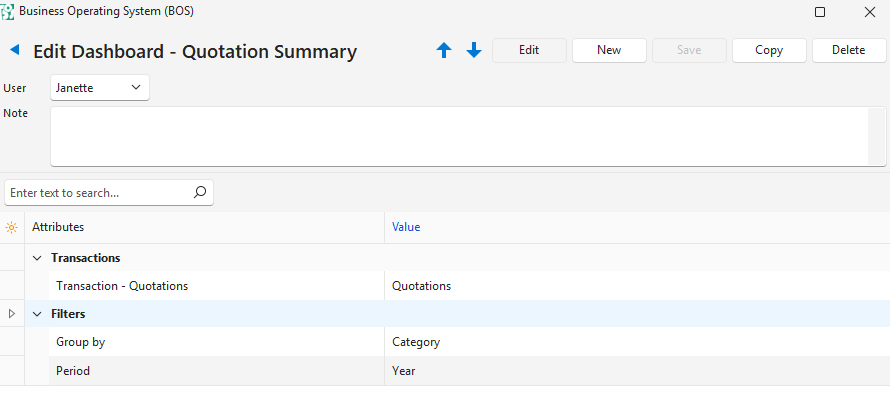
Quotation Summary
- The Quotation Summary displays a visual representation of quotation values.
- The information is grouped by the selected filter and delineated by status (e.g. pending, lost, accepted).
Attributes
| Attributes | Description |
|---|---|
| Transaction – Quotations | A dropdown list of all the created Transaction Types for users to select the one they use for quotations. |
Filters
| Filters | Description |
|---|---|
| Group by | A dropdown list for users to select: – Rep: Transaction totals are grouped by Rep. – Category: Transaction totals are grouped by Category. |
| Period | An option to select Month or Year as the period. – Month: The current month’s quotation totals are displayed. Bars are colour-coded and delineated by status. – Year: The current year’s quotation totals are displayed. Bars are colour-coded and delineated by status. |
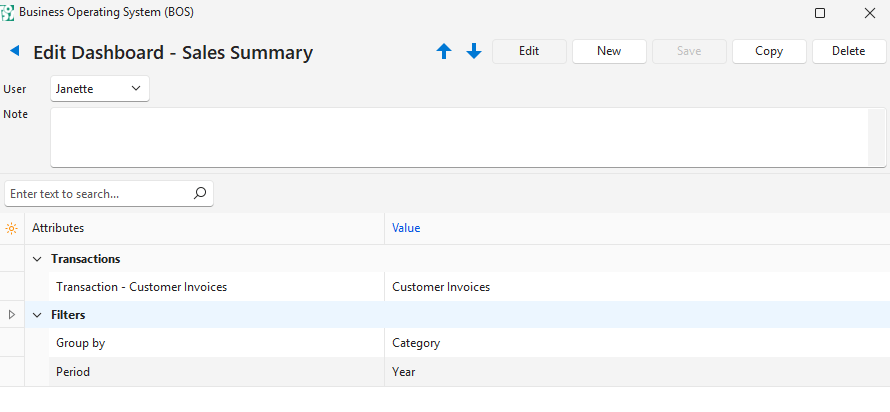
Sales Summary
- The Sales Summary provides a visual representation of the sales’ values for the selected filters.
Attributes
| Attributes | Description |
|---|---|
| Transaction – Customer Invoices | A dropdown list of all the created Transaction Types for users to select the one they use for customer invoices. |
Filters
| Filters | Description |
|---|---|
| Group by | A dropdown list for users to select: – Rep: Transaction totals are grouped by Rep. – Category: Transaction totals are grouped by Category. |
| Period | An option to select Month or Year as the period. – Month: The current month’s customer-invoice totals are displayed. – Year: The current year’s customer-invoice totals are displayed. |
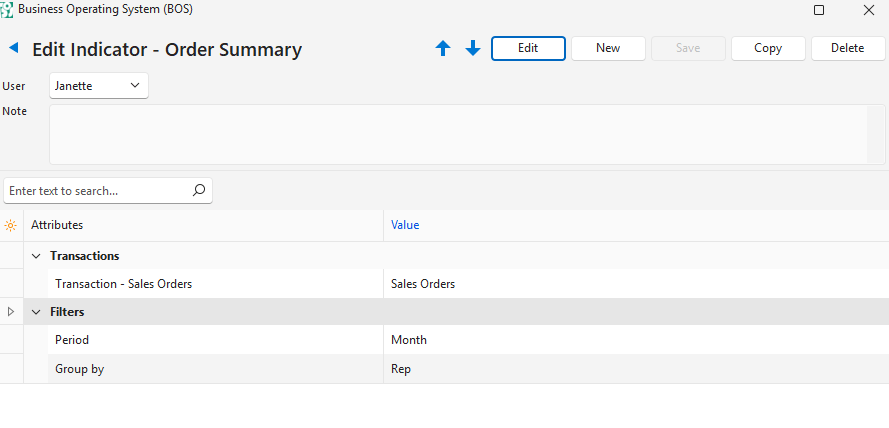
Order Summary
- The Order Summary provides a visual representation of Sales Orders.
Attributes
| Attributes | Description |
|---|---|
| Transaction – Sales Orders | A dropdown list of all the created Transaction Types for users to select the one they use for sales orders. |
Filters
| Filters | Description |
|---|---|
| Period | A dropdown list for users to select: – Month: The current month’s sales orders are displayed. – Year: The current year’s sales orders are displayed. |
| Group by | A dropdown list for users to select: – Rep: Transaction totals are grouped by Rep. – Category: Transaction totals are grouped by Category. |
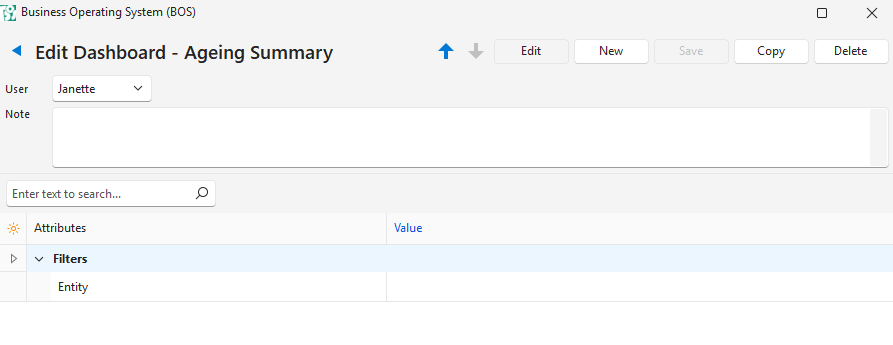
Ageing Summary
- The Ageing Summary provides a visual representation of the Customer and Supplier Age Analyses for today (i.e. the day on which you are viewing the dashboard).
- Totals for the ageing periods are displayed in columns.

Filters
| Filters | Description |
|---|---|
| Entity | Option to select a Registered Entity from a dropdown list. Can be left blank to include all the registered entities. |