1. Home
  2. Knowledge Base
  3. Output, Emails, and Designers
  4. Form Designer – Reportbuilder Tutorials

Form Designer – Reportbuilder Tutorials

QuickEasy BOS has incorporated Reportbuilder, a form designer that allows users to customise all their templates (e.g. statements, invoices, emails).

Users have access to the Data Tables and Fields, as well as editing tools to help them design forms.

These tutorials explain how to create templates.

Navigation: Main Menu > Setup > Form Designer > Reportbuilder

Reportbuilder templates may be designed from scratch, copied from an existing template and edited, or created using the form wizard from Reportbuilder > File > New > Report Wizard.

How to Create a Template

  • Quotation template is created as an example. The same procedure can be used for all Transaction Types.
  • You can create multiple Templates for the same Transaction Type.
  • When an entry is placed, there are two fields: one that contains the label and one that contains the data. You can delete the label field by clicking it and pressing Delete. You can still see a Description of the data field by clicking the field and looking at the row directly below the icons. The name of the table and the field are displayed.
  1. Create a template in QuickEasy BOS so that the name of the form is created either through the Transaction Type or Output Templates module.
  2. Open a list of Quotations.
    • Note: You cannot create a form if there is no data because the data fields will not be available to input into the form or to preview.
    • Note: The data fields available on Form Designer are created from the view that is open on the screen in BOS.
  3. Navigate to the Reportbuilder (Main Menu > Setup > Form Designer > Reportbuilder).
  4. Click File > New Report.
  5. Drag the sections (Header, Detail, Footer) down using the dividing grey bars to expand them.
  6. Check if the Data Tree panel is open on your right. If not, add it from Main Menu > View > Toolbars > Data Tree
  7. A list of the available tables from BOS is displayed on the right. When you click an entry on the Data Tree it opens a list below it that shows all the available fields. (Drag the bar that separates the two panels up or down to resize the panels.)

How to Create the Header for Transactions

  1. Entity Information:
    1. Click the entry with information about your entity, named trans_entity under the Data Tree.
    2. On the top row of icons, click DB Image (the icon with the picture) and click inside the header section to place it.
    3. On the left in the Data section, type template_image next to DataField.
    4. Check that the DataPipeline shows trans_entity (directly below DataField). If it does not, overtype the entry with trans_entity.
    5. Use the dots to drag and resize the entry until it is placed where you need it.
    6. On the left under Layout – Dynamic check the checkbox next to Stretch to adjust the logo to fit inside the block.
    7. On the top row of icons, click DBRich Text icon (the icon with the red A) and click inside the header section to place it.
    8. On the left in the Data section, type template_masthead_rtf next to DataField.
    9. Check that the DataPipeline shows trans_entity, else overtype the entry.
    10. If the Header section is too small, drag the bar with the Header label down to increase the Header’s size.
    11. Click the line icon and click the header section just below the placed fields.
    12. Drag the line using the dots until it spans the entire header section.
    13. Press Ctrl S to save your work.
  2. Customer Information:
    1. Click the Label (icon) and click the form to place the label.
    2. Double-click inside the label and type Quotation. Use the text functions above the form to centre the label, make it bold, and to increase the font size.
    3. Click trans_header under Data Tree to access information on the transaction’s header.
    4. Click and drag the following fields into the Header Section:
      1. company_name (inserts the customer’s name).
      2. contact_name (inserts the name of the customer’s contact person).
    5. Click trans_customer under Data Tree.
    6. Click and drag email into the header section.
    7. For each of the added fields:
      • Delete the labels (first part that shows the name of the field).
      • Click the field and overtype the following fields in the Layout section:
        • Height = 5
        • Left = 6
        • Width = 75
      • Drag the fields to space them vertically which sets the top margin.
    8. Click trans_header under Data Tree.
    9. Click and drag address into the header, next to the company name.
  3. Document Information:
    1. Next to the address, create labels for:
      1. Number (QT No.)
      2. Date
      3. Rep
    2. Click trans_header under the Data Tree.
      1. Drag trans_no from the Fields section next to the text Number
      2. Drag date_trans from the Fields section next to the text Date
    3. Click trans_rep and drag nickname from the Fields section next to the text Rep.
    4. For each of the added fields, adjust the layout as described in Step 2g.
  4. Labels:
    1. Insert a horizontal line below the previous entries (click the line icon and drag the line to span the page).
    2. Insert labels just below the line and above the section break for the following fields:
      1. Description
      2. Qty
      3. Unit
      4. Adj % (Include this field only if the adjustment is negative (a discount) that you want to make the customer aware of.)
      5. Unit Price
      6. Total (Exc)
      7. VAT
      8. Total (Inc)
      9. Change the labels’ appearance and size (e.g. bold, 10 pts).
      10. Insert another line below the labels.
      11. Press Ctrl S to save your work.
  5. Click Preview (tab) to see what the layout looks like. Adjust as needed.

How to Create the Detail Section

  1. Click the icon next to Report Tree to switch the left-side panel to Report View.
  2. In the block on the left that shows Data select trans_items from the dropdown list next to DataPipeline.
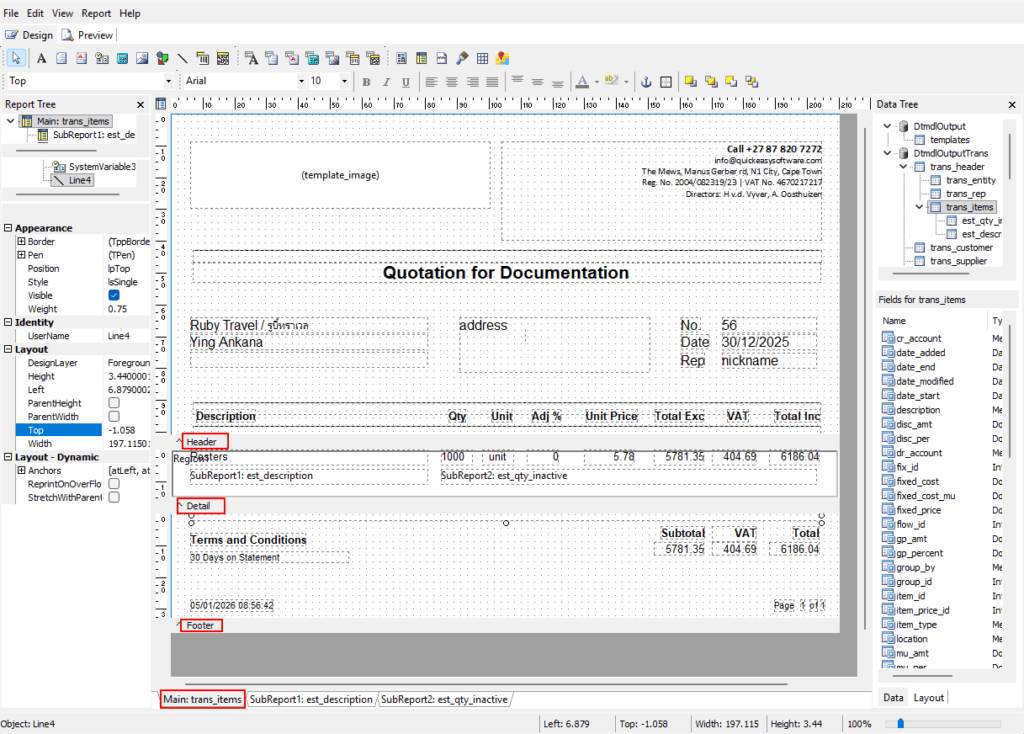
  3. Click the Region (icon) (6th icon from the right) and click the detail section.
  4. Under Appearance click the plus sign next to Pen.
    • Change the Style to psClear.
  5. Under Layout check the checkboxes next to ParentWidth and ParentHeight.
  6. Under Layout – Dynamic check KeepTogether.
    • Note: The region block helps to keep the data together and will insert a new page if there are too many transactions.
  7. Click trans_items on the Data Tree and drag the following fields into the region block below where the headings were created:
    1. description 
    2. qty 
    3. unit
    4. disc_per (adjustment percentage: Adj %)
    5. total_unit_cur (This field is the total unit price in the transaction’s currency.)
    6. total_cur (This field is the total due, excluding VAT in the transaction’s currency.)
    7. vat_cur (This field is the VAT amount.) 
    8. total_vat_cur (Total due including VAT in the transaction’s currency.) 
  8. Align the added fields using the icons on the font section. The totals should be aligned right.
  9. Change the font size and colour (e.g. black 10 pts) using the options on the font section.
  10. Press Ctrl S to save your work.
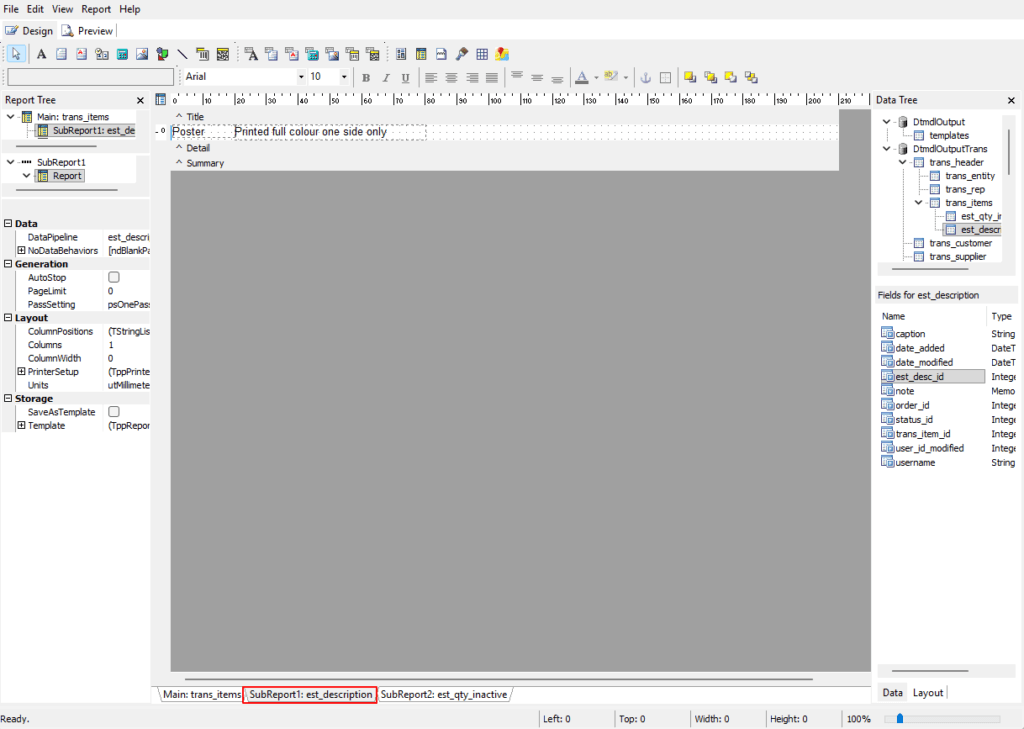
  11. Add a sub report (inside the region) to show the full Estimate Description as follows:
  12. Click the SubReport icon (yellow icon 5th from the right).
    1. Next to DataPipeline select est_description.
    2. Uncheck the checkbox next to ParentWidth.
    3. Type the width to match the width of the description (e.g. 75).
    4. Align the sub report with the description.
    5. Click the tab at the bottom that shows SubReport1: est_description.
      1. Drag these fields into the Detail section:
        • caption
        • note
      2. Align the fields next to each other. Look at the margin bar and check that the fields end where the description ends on the main report (Main: trans_items).
      3. Adjust the font and alignment as needed.
      4. For the Note field below Layout – Dynamic, check the checkbox next to Stretch. This step expands the block to fit the full description.
      5. Press Ctrl S to save your work.
  1. Click the tab Main: trans_items to return to the main report.
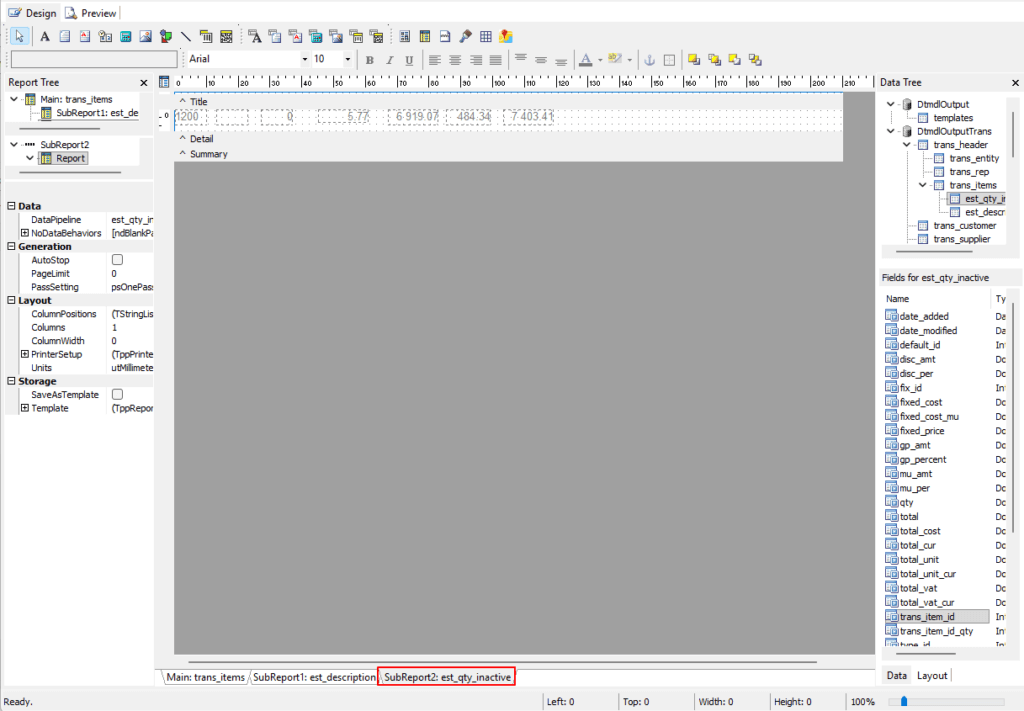
  2. Add a sub report to show inactive quantities as follows:
    1. Click the SubReport (icon) (5th from the right) and click the region block to add it.
    2. Select est_qty_inactive as the DataPipeline.
    3. Click the tab at the bottom that shows SubReport2: est_qty_inactive
      1. Drag the same fields as mentioned in Step 7b-h from est_qty_inactive and place them aligned with the fields matching their names.
        • Write down the left margin and width of each field to help you align them.
        • Place them on the right until they are all placed.
        • Hold down the shift key and click on all the fields to select them.
        • Move them to the left so they start where SupReport2 starts. (SubReport2 starts under the Qty column on the main design – see the screenshot.)
      2. Change the font, text colour (grey) and alignment of the fields.
      3. For each of the number fields click the three ellipses next to DisplayFormat under Text. Select the second option from the dropdown list.
  3. Click the tab Main: trans_items to return to the main report.
  4. Press Ctrl S to save your work.
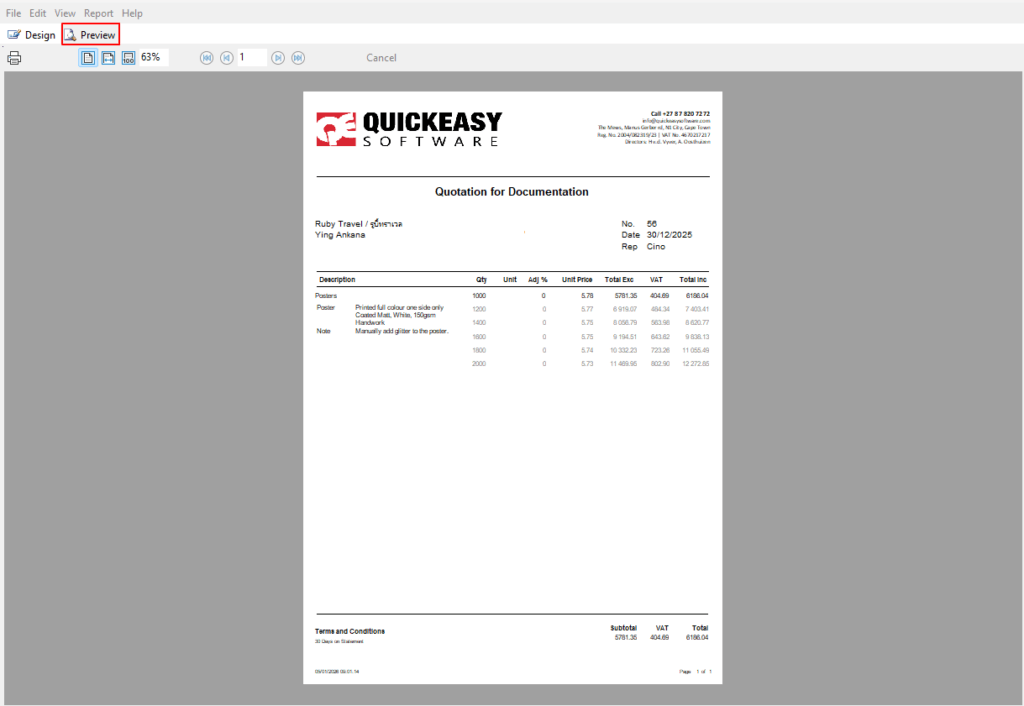
  5. Click Preview (tab) to check that the report is generated correctly.

  1. Insert a horizontal line on the first line of the footer (click the line icon, click the footer, and drag the line to span the page).
  2. Click the label icon (the large black A).
  3. Click inside the footer section to place the label and drag it to the left.
  4. Double-click the placed label and change the text to Terms & Conditions.
  5. Click trans_header on the Data Tree and drag credit_term from the fields below the label you created in Step 2. Resize the field to allow for a block of text if you have complicated terms.
  6. Delete the label name (optional).
  7. Create labels for the following fields and align them on the right below the respective fields in the detail section:
    1. Subtotal
    2. VAT
    3. Total
  8. Click trans_header on the Data Tree:
    1. Drag the field total_cur below the text Subtotal.
    2. Drag the field vat_cur below the text VAT.
    3. Drag the field total_vat_cur below the field Total.
    4. For each of these fields, in the Text section on the left click the ellipses next to DisplayFormat and select the second option (which uses 2 decimal places).
  9. Press Ctrl S to save your work.
  10. Click the icon System Variables (5th icon from the left).
    1. Click the form to place it.
    2. Select one of the options (e.g. date, time, page number) on the dropdown list, which is just below the row of icons and shows Date at first.
    3. Add more System Variables if needed. For example, place the date and time below the terms and conditions so you have a record of when the quotation was generated. Place the page number and page count on the right. Insert labels if needed (e.g. Page (label), page number (variable), of (label), page count (variable)).
  11. In the Layout block on the left: Adjust all the fields to be aligned and where applicable have the same width and height.
    • Note: If the layout block is not there, you are still in Report View. Click any field on the table to switch back to Layout View.
  12. Press Ctrl S to save.

Reportbuilder Fields

Reportbuilder Sub Report

Reportbuilder Sub Report

Reportbuilder Preview

Tips

  • If the preview does not display anything, go to a transaction and output the report. Close the output and return to Reportbuilder. This step tends to trigger the preview.
  • Drag fields anywhere onto the relevant section and use the layout block on the left to type the actual coordinates, instead of trying to visually position and align the fields. This method also helps you coordinate the heights and widths of fields.
  • After dragging a field onto a section, click anywhere else in that section. This breaks the label and field into two parts which makes it easier to then delete the label part.
  • Instead of double-clicking labels, you can also enter the caption in the Text section on the left.
  • To start over, simply create a new form and save it over the existing form.

How to Copy a Template

  • Copying a template is easier than creating a new template from scratch because most of the fields are already there; you only need to edit them.
  • Copying forms also ensures consistency because all the layouts follow the same pattern (e.g. logo on the left, address on the right).
  1. Create a template in BOS so that the name of the form is created either through the Transaction Type or Output Templates module.
  2. Open a Transaction list (e.g. Main Menu > Workflow > Quotations).
    • Note: You cannot create a form before entering data, because the fields are only created as data is input.
    • Note: The data fields available on Form Designer are created from the view that is open on screen.
  3. Click Main Menu > File > Open and select a template from the list. (Or Main Menu > File > Load From File to open a report created elsewhere.)
  4. Click Open (button).
  5. If you receive the message Error Reading Template, click Ignore All and relink the template once it is loaded.
  6. Save the template before changing it: click Main Menu > File > Save As and select an option on the list (the name you created in Step 1), click Save (button).
  7. Make any changes as needed:
    1. Add fields as required.
    2. Click a field and press Delete on your keyboard to remove it.
    3. Click a field and drag it to reposition it.
    4. Click a field and use the dots to resize it.
    5. Double click a text field to change the text.
  8. Remember to save your work often because there is no auto-save feature (press Ctrl S).

  • When you receive a message Error Reading Template, it often means that the template is looking for data fields that are not in your current version of QuickEasy BOS. It mostly happens when you import a template from another database.
  • In that case, you must relink the fields to your current data fields.
  1. Click the field you want to change.
  2. At the top (below the icon row), the list of fields is opened.
    1. From the dropdown list in the first block, select the Data Table.
    2. From the dropdown list in the second block, select the Field.
  3. Repeat Steps 1-2 until all the fields are relinked.
  4. Save the form (Main Menu > File > Save or Ctrl S).

How to Change the Print Setup

  1. Click the icon next to Report Tree to switch the left-side panel to Report View.
  2. In the Layout (tab) on the left, click the + next to PrinterSetup to expand the view.
  3. Select the printer next to PrinterName from the dropdown list of all the printers you have installed.
  4. Change any of the other settings, as necessary.
  5. Click Main Menu > File > Save.

About Data Pipelines

  • All the data is in DtmdlOutput.
  • Each field under DtmdlOutput consists of multiple sub-fields.
  • If you click a field, the sub-fields are displayed in an expanded tree view or in the block below (depending on your settings).
  • Each sub-field is linked to its parent field.
    • You cannot use a sub-field without including the parent field because the form must know where to fetch the data from (it needs the link).
    • This rule also applies to sub-fields of sub-fields.
    • For example, if you want to display quantities, you need to include the header (trans_header) to indicate where the quantities source from (e.g. Quotation) and the sub-field that contains the quantity (e.g. est_qty) before you can display the quantity (qty).
    • The information must be inserted into the form using DBText or DBMemo fields. (Do not use rich-text fields to access these pipelines because rich-text fields do not create the necessary links).
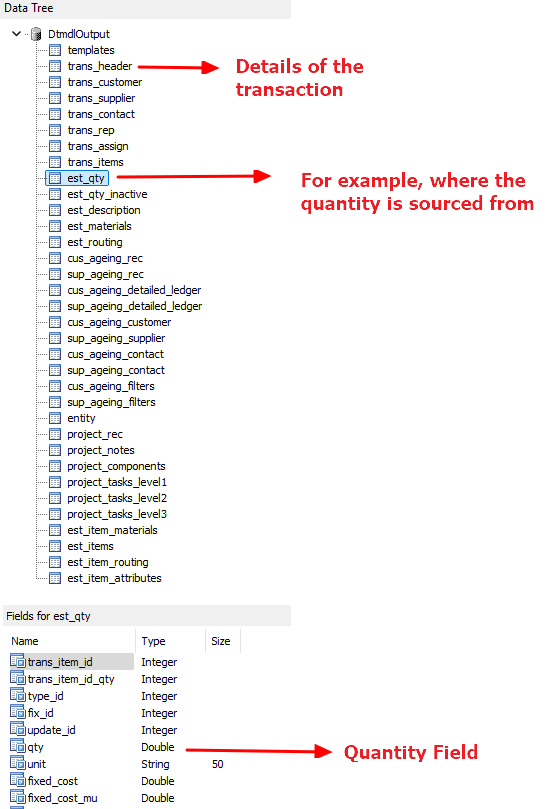
Image of a Data Tree
Reportbuilder Data Fields

Learn More

  1. Email Edit View: Explains the interface from which emails can be created.
  2. Email List View: Explains the interface that lists all the emails that have been created.
  3. Email Templates: Explains the interface from which email templates can be created. Lists all the available data fields.
  4. Form Designer Interface: Explains the commonly used features for the Form Designer.
  5. Output Button: Explains the Output button that is available on most views.
  6. Output Template Tutorials: These tutorials explain how to add templates to transaction types and other modules.
  7. Output Templates Module: Explains the Output Templates interface.

ตัวออกแบบแบบฟอร์ม – บทช่วยสอน Reportbuilder

QuickEasy BOS ได้รวม Reportbuilder ซึ่งเป็น ตัวออกแบบแบบฟอร์มที่ช่วยให้ผู้ใช้สามารถปรับแต่งเทมเพลตทั้งหมดของตนได้ (เช่น ใบแจ้งยอด ใบแจ้งหนี้ อีเมล)

ผู้ใช้ มีสิทธิ์เข้าถึง ตารางข้อมูล และ ฟิลด์ ตลอดจนเครื่องมือแก้ไขเพื่อช่วยในการออกแบบแบบฟอร์ม

บทช่วยสอนเหล่านี้อธิบายวิธีสร้างเทมเพลต

การนําทาง: เมนู > หลัก Setup > Form Designer > Reportbuilder

แม่แบบตัวสร้างรายงานอาจได้รับการออกแบบตั้งแต่เริ่มต้น คัดลอกจากแม่แบบที่มีอยู่และแก้ไข หรือสร้างขึ้นโดยใช้ตัวช่วยสร้างฟอร์มจากตัวช่วยสร้างรายงานใหม่>ของแฟ้ม > Reportbuilder >

วิธีสร้างเทมเพลต

  • เท็มเพลตใบเสนอราคาถูกสร้างขึ้นเป็นตัวอย่าง กระบวนงานเดียวกันนี้สามารถใช้ได้กับชนิดธุรกรรมทั้งหมด
  • คุณสามารถสร้างเทมเพลตได้หลายแบบสําหรับชนิดธุรกรรมเดียวกัน
  • เมื่อมีการวางรายการ จะมีสองเขตข้อมูล: เขตข้อมูลหนึ่งที่มีป้ายชื่อและอีกเขตข้อมูลหนึ่งที่มีข้อมูล คุณสามารถลบฟิลด์ป้ายชื่อได้โดยคลิกที่ช่องป้ายชื่อแล้วกด Delete คุณยังคงสามารถดู คําอธิบาย ของฟิลด์ข้อมูลได้โดยคลิกที่ฟิลด์และดูที่แถวด้านล่างไอคอนโดยตรง ชื่อของตารางและเขตข้อมูลจะปรากฏขึ้น
  1. สร้างเท็มเพลตใน QuickEasy BOS เพื่อให้ชื่อของฟอร์มถูกสร้างขึ้นผ่านโมดูล ชนิดธุรกรรม หรือ เท็มเพลตเอาต์พุต
  2. Open a list of Quotations.
    • หมายเหตุ คุณไม่สามารถสร้างฟอร์มได้ถ้าไม่มีข้อมูล เนื่องจากเขตข้อมูลจะไม่พร้อมให้ป้อนลงในฟอร์มหรือแสดงตัวอย่าง
    • หมายเหตุ ฟิลด์ข้อมูลที่พร้อมใช้งานบน Form Designer ถูกสร้างขึ้นจากมุมมองที่เปิดอยู่บนหน้าจอใน BOS
  3. นําทางไปยัง Reportbuilder (เมนูหลัก > การตั้งค่า >ตัวออกแบบฟอร์ม > Reportbuilder)
  4. คลิก File > New Report
  5. ลากส่วนต่างๆ (หัวกระดาษ รายละเอียด ท้ายกระดาษ) ลงโดยใช้แถบสีเทาที่แบ่งเพื่อขยาย
  6. ตรวจสอบว่าแผงแผนผังข้อมูลเปิดอยู่ทางด้านขวาของคุณหรือไม่ หากไม่เป็นเช่นนั้น ให้เพิ่มจากเมนู>หลัก มุมมอง > แถบ>เครื่องมือ แผนผังข้อมูล
  7. รายการของตารางที่พร้อมใช้งานจาก BOS จะแสดงทางด้านขวา เมื่อคุณคลิกรายการบน แผนผังข้อมูล มันจะเปิดรายการด้านล่างที่แสดงเขตข้อมูลที่มีอยู่ทั้งหมด (ลากแถบที่แยกแผงทั้งสองขึ้นหรือลงเพื่อปรับขนาดแผง)

วิธีสร้างส่วนหัวสําหรับธุรกรรม

  1. ข้อมูลเอนทิตี:
    1. คลิกรายการที่มีข้อมูลเกี่ยวกับเอนทิตีของคุณ ซึ่งตั้งชื่อว่า trans_entity ภายใต้แผนผังข้อมูล
    2. ที่แถวบนสุดของไอคอน ให้คลิก DB Image (ไอคอนที่มีรูปภาพ) แล้วคลิกภายในส่วนหัวเพื่อวาง
    3. ทางด้านซ้ายในส่วน ข้อมูล ให้พิมพ์ template_image ถัดจาก DataField
    4. ตรวจสอบว่า DataPipeline แสดง trans_entity (ด้านล่าง DataField โดยตรง) หากไม่เป็นเช่นนั้น ให้พิมพ์ทับรายการด้วย trans_entity
    5. ใช้จุดเพื่อลากและปรับขนาดรายการจนกว่าจะวางไว้ในตําแหน่งที่คุณต้องการ
    6. ทางด้านซ้ายใต้ เลย์เอาต์ – ไดนามิก ให้เลือกช่องทําเครื่องหมายถัดจาก ยืด เพื่อปรับโลโก้ให้พอดีกับบล็อก
    7. ที่แถวบนสุดของไอคอน ให้คลิกไอคอน DBRich Text (ไอคอนที่มี A สีแดง) แล้วคลิกภายในส่วนหัวเพื่อวาง
    8. ทางด้านซ้ายในส่วน ข้อมูล ให้พิมพ์ template_masthead_rtf ถัดจาก เขตข้อมูล
    9. ตรวจสอบว่า DataPipeline แสดง trans_entity มิฉะนั้นให้พิมพ์รายการมากเกินไป
    10. ถ้าส่วน หัวกระดาษ มีขนาดเล็กเกินไป ให้ลากแถบที่มีป้ายชื่อ หัวกระดาษ ลงเพื่อเพิ่มขนาดของส่วนหัว
    11. คลิกไอคอนเส้นและคลิกส่วนหัวด้านล่างช่องที่วางไว้
    12. ลากเส้นโดยใช้จุดจนกระทั่งขยายส่วนหัวทั้งหมด
    13. กด Ctrl S เพื่อบันทึกงานของคุณ
  2. ข้อมูลลูกค้า:
    1. คลิกป้าย กํากับ (ไอคอน) แล้วคลิกแบบฟอร์มเพื่อวางป้ายกํากับ
    2. ดับเบิลคลิกภายในป้ายชื่อ แล้วพิมพ์ ใบเสนอราคา ใช้ฟังก์ชันข้อความเหนือแบบฟอร์มเพื่อจัดป้ายชื่อให้อยู่กึ่งกลาง ทําให้เป็นตัวหนา และเพื่อเพิ่มขนาดแบบอักษร
    3. คลิก trans_header ใต้ แผนผังข้อมูล เพื่อเข้าถึงข้อมูลเกี่ยวกับส่วนหัวของธุรกรรม
    4. Click and drag the following fields into the Header Section:
      1. company_name (แทรกชื่อลูกค้า)
      2. contact_name (ใส่ชื่อผู้ติดต่อของลูกค้า)
    5. คลิก trans_customer ภายใต้ แผนผังข้อมูล
    6. คลิกและลาก อีเมล ลงในส่วนหัว
    7. สําหรับแต่ละช่องที่เพิ่มเข้ามา ให้ทําดังนี้
      • ลบป้ายชื่อ (ส่วนแรกที่แสดงชื่อของเขตข้อมูล)
      • คลิกที่ฟิลด์และพิมพ์ทับฟิลด์ต่อไปนี้ในส่วน เค้าโครง :
        • ความสูง = 5
        • ซ้าย = 6
        • ความกว้าง = 75
      • ลากเขตข้อมูลเพื่อเว้นระยะห่างในแนวตั้งซึ่งจะกําหนดระยะขอบด้านบน
    8. คลิก trans_header ภายใต้ แผนผังข้อมูล
    9. คลิกและลาก ที่อยู่ ลงในส่วนหัวถัดจากชื่อบริษัท
  3. ข้อมูลเอกสาร:
    1. ถัดจากที่อยู่ ให้สร้างป้ายกํากับสําหรับสิ่งต่อไปนี้
      1. หมายเลข (หมายเลข QT)
      2. วันที่
      3. ตัวแทน
    2. Click trans_header under the Data Tree.
      1. ลาก trans_no จากส่วนเขตข้อมูลถัดจากข้อความตัวเลข
      2. ลาก date_trans จากส่วนฟิลด์ถัดจากข้อความวันที่
    3. คลิก trans_rep แล้วลากชื่อเล่นจากส่วนฟิลด์ถัดจากข้อความตัวแทน
    4. สําหรับแต่ละฟิลด์ที่เพิ่ม ให้ปรับเค้าโครงตามที่อธิบายไว้ในขั้นตอนที่ 2g
  4. ป้ายกํากับ:
    1. แทรกเส้นแนวนอนด้านล่างรายการก่อนหน้า (คลิกไอคอนเส้นแล้วลากเส้นเพื่อขยายหน้า)
    2. แทรกป้ายชื่อใต้บรรทัดและเหนือตัวแบ่งส่วนสําหรับเขตข้อมูลต่อไปนี้:
      1. คำอธิบาย
      2. จํานวน
      3. หน่วย
      4. Adj % (รวมช่องนี้เฉพาะเมื่อการปรับเป็นลบ (ส่วนลด) ที่คุณต้องการให้ลูกค้าทราบ)
      5. ราคาต่อหน่วย
      6. รวม (ไม่รวม)
      7. ภาษีมูลค่าเพิ่ม
      8. รวม (Inc)
      9. เปลี่ยนลักษณะและขนาดของป้ายกํากับ (เช่น ตัวหนา 10 จุด)
      10. แทรกอีกบรรทัดหนึ่งใต้ป้ายผนึก
      11. กด Ctrl S เพื่อบันทึกงานของคุณ
  5. คลิก แสดงตัวอย่าง (แท็บ) เพื่อดูว่าเค้าโครงมีลักษณะอย่างไร ปรับตามต้องการ

วิธีสร้างส่วนรายละเอียด

  1. คลิกไอคอนถัดจากแผนผังรายงานเพื่อเปลี่ยนแผงด้านซ้ายเป็นมุมมองรายงาน
  2. ในบล็อกทางด้านซ้ายที่แสดงข้อมูล ให้เลือก trans_items จากรายการดรอปดาวน์ถัดจาก DataPipeline
  3. คลิก ภูมิภาค (ไอคอน) (ไอคอนที่ 6 จากขวา) แล้วคลิกส่วนรายละเอียด
  4. ภายใต้ ลักษณะที่ปรากฏ ให้คลิกเครื่องหมายบวกถัดจากปากกา
    • เปลี่ยนสไตล์เป็น psClear
  5. ภายใต้ เค้าโครง ให้เลือกช่องทําเครื่องหมายถัดจาก ParentWidth และ ParentHeight
  6. ภายใต้ เค้าโครง – ไดนามิก ตรวจสอบ KeepTogether
    • หมายเหตุ บล็อกภูมิภาคช่วยในการเก็บข้อมูลไว้ด้วยกันและจะแทรกหน้าใหม่หากมีธุรกรรมมากเกินไป
  7. Click trans_items on the Data Tree and drag the following fields into the region block below where the headings were created:
    1. คําอธิบาย
    2. จํานวน
    3. หน่วย
    4. disc_per (เปอร์เซ็นต์การปรับ: Adj %)
    5. total_unit_cur (ฟิลด์นี้คือราคารวมต่อหน่วยในสกุลเงินของธุรกรรม)
    6. total_cur (ฟิลด์นี้เป็นยอดรวมที่ต้องชําระ ไม่รวม VAT ในสกุลเงินของธุรกรรม)
    7. vat_cur (ฟิลด์นี้คือยอดเงิน VAT)
    8. total_vat_cur (ยอดรวมที่ต้องชําระรวมภาษีมูลค่าเพิ่มในสกุลเงินของธุรกรรม)
  8. จัดแนวฟิลด์ที่เพิ่มโดยใช้ไอคอนในส่วนฟอนต์ ผลรวมควรอยู่ในแนวที่ถูกต้อง
  9. เปลี่ยนขนาดและสีแบบอักษร (เช่น สีดํา 10 จุด) โดยใช้ตัวเลือกในส่วนแบบอักษร
  10. กด Ctrl S เพื่อบันทึกงานของคุณ
  11. เพิ่มรายงานย่อย (ภายในภูมิภาค) เพื่อแสดง คําอธิบายการประมาณการ แบบเต็มดังนี้:
  12. คลิกไอคอน รายงานย่อย (ไอคอนสีเหลืองที่ 5 จากขวา)
    1. ถัดจาก DataPipeline ให้เลือก est_description
    2. ยกเลิกการเลือกช่องทําเครื่องหมายถัดจาก ParentWidth
    3. พิมพ์ความกว้างให้ตรงกับความกว้างของคําอธิบาย (เช่น 75)
    4. จัดแนวรายงานย่อยให้ตรงกับคําอธิบาย
    5. คลิกแท็บที่ด้านล่างที่แสดง SubReport1: est_description
      1. ลากฟิลด์เหล่านี้ลงในส่วน รายละเอียด :
        • คําบรรยายภาพ
        • บันทึก
      2. จัดแนวเขตข้อมูลที่อยู่ติดกัน ดูที่แถบระยะขอบ และตรวจสอบว่าเขตข้อมูลสิ้นสุดที่คําอธิบายสิ้นสุดในรายงานหลัก (หลัก: trans_items)
      3. ปรับแบบอักษรและการจัดตําแหน่งตามต้องการ
      4. สําหรับฟิลด์ โน้ต ด้านล่าง เค้าโครง – ไดนามิก ให้เลือกช่องทําเครื่องหมายถัดจาก ยืด ขั้นตอนนี้จะขยายบล็อกให้พอดีกับคําอธิบายแบบเต็ม
      5. กด Ctrl S เพื่อบันทึกงานของคุณ
  1. คลิกแท็บ หลัก: trans_items เพื่อกลับไปยังรายงานหลัก
  2. เพิ่มรายงานย่อยเพื่อแสดงปริมาณที่ไม่ได้ใช้งานดังนี้:
    1. คลิก รายงานย่อย (ไอคอน) (ที่ 5 จากขวา) แล้วคลิกบล็อกภูมิภาคเพื่อเพิ่ม
    2. เลือก est_qty_inactive เป็น DataPipeline
    3. คลิกแท็บที่ด้านล่างที่แสดง SubReport2: est_qty_inactive
      1. Drag the same fields as mentioned in Step 7b-h from est_qty_inactive and place them aligned with the fields matching their names.
        • จดระยะขอบด้านซ้ายและความกว้างของแต่ละช่องเพื่อช่วยคุณจัดแนว
        • วางไว้ทางด้านขวาจนกว่าจะวางไว้ทั้งหมด
        • กดปุ่ม shift ค้างไว้แล้วคลิกที่ฟิลด์ทั้งหมดเพื่อเลือก
        • ย้ายไปทางซ้ายเพื่อให้เริ่มจากจุดเริ่มต้นของ SupReport2 (SubReport2 เริ่มต้นภายใต้คอลัมน์ Qty ในการออกแบบหลัก – ดูภาพหน้าจอ)
      2. เปลี่ยนแบบอักษร สีข้อความ (สีเทา) และการจัดตําแหน่งของฟิลด์
      3. สําหรับแต่ละเขตข้อมูลตัวเลข ให้คลิกจุดไข่ปลาสามจุดที่อยู่ถัดจาก DisplayFormat ภายใต้ ข้อความ เลือกตัวเลือกที่สองจากรายการดรอปดาวน์
  3. คลิกแท็บ หลัก: trans_items เพื่อกลับไปยังรายงานหลัก
  4. กด Ctrl S เพื่อบันทึกงานของคุณ
  5. คลิก แสดงตัวอย่าง (แท็บ) เพื่อตรวจสอบว่ารายงานถูกสร้างขึ้นอย่างถูกต้อง

วิธีสร้างส่วนท้าย

  1. แทรกเส้นแนวนอนบนบรรทัดแรกของท้ายกระดาษ (คลิกไอคอนเส้น คลิกท้ายกระดาษ แล้วลากเส้นเพื่อขยายหน้ากระดาษ)
  2. คลิกไอคอนป้ายกํากับ (A สีดําขนาดใหญ่)
  3. คลิกภายในส่วนท้ายเพื่อวางป้ายกํากับแล้วลากไปทางซ้าย
  4. ดับเบิลคลิกที่ป้ายกํากับที่วางไว้ แล้วเปลี่ยนข้อความเป็น ข้อกําหนดและเงื่อนไข
  5. คลิก trans_header บน แผนผังข้อมูล แล้วลาก credit_term จากเขตข้อมูลด้านล่างป้ายกํากับที่คุณสร้างขึ้นใน ขั้นตอนที่ 2 ปรับขนาดเขตข้อมูลเพื่อให้มีบล็อกข้อความหากคุณมีคําศัพท์ที่ซับซ้อน
  6. ลบชื่อป้ายกํากับ (ไม่บังคับ)
  7. Create labels for the following fields and align them on the right below the respective fields in the detail section:
    1. ผลรวมย่อย
    2. ภาษีมูลค่าเพิ่ม
    3. รวม
  8. Click trans_header on the Data Tree:
    1. ลากเขตข้อมูล total_cur ใต้ข้อความ ผลรวมย่อย
    2. ลาก vat_cur เขตข้อมูลด้านล่างข้อความ VAT
    3. ลากเขตข้อมูล total_vat_cur ด้านล่างเขตข้อมูล ผลรวม
    4. สําหรับแต่ละฟิลด์เหล่านี้ ในส่วน ข้อความ ทางด้านซ้าย ให้คลิกจุดไข่ปลาถัดจาก DisplayFormat แล้วเลือกตัวเลือกที่สอง (ซึ่งใช้ทศนิยม 2 ตําแหน่ง)
  9. กด Ctrl S เพื่อบันทึกงานของคุณ
  10. Click the icon System Variables (5th icon from the left).
    1. คลิกแบบฟอร์มเพื่อวาง
    2. เลือกตัวเลือกใดตัวเลือกหนึ่ง (เช่น วันที่ เวลา หมายเลขหน้า) ในรายการดรอปดาวน์ ซึ่งอยู่ใต้แถวของไอคอนและแสดง วันที่ ในตอนแรก
    3. เพิ่ม ตัวแปรระบบ เพิ่มเติมหากจําเป็น ตัวอย่างเช่น วางวันที่และเวลาไว้ใต้ข้อกําหนดและเงื่อนไข เพื่อให้คุณมีบันทึกเวลาที่ใบเสนอราคาถูกสร้างขึ้น วางหมายเลขหน้าและจํานวนหน้าทางด้านขวา แทรกป้ายกํากับหากจําเป็น (เช่น หน้า (ป้ายกํากับ) หมายเลขหน้า (ตัวแปร) ของ (ป้ายกํากับ) จํานวนหน้า (ตัวแปร))
  11. In the Layout block on the left: Adjust all the fields to be aligned and where applicable have the same width and height.
    • หมายเหตุ ถ้าไม่มีบล็อกเค้าโครง แสดงว่าคุณยังคงอยู่ใน มุมมองรายงาน คลิกเขตข้อมูลใดๆ บนตารางเพื่อสลับกลับไปยัง มุมมองเค้าโครง
  12. กด Ctrl S เพื่อบันทึก

ฟิลด์ Reportbuilder

รายงานย่อย Reportbuilder

รายงานย่อย Reportbuilder

ตัวอย่าง Reportbuilder

เคล็ดลับ

  • หากการแสดงตัวอย่างไม่แสดงอะไรเลย ให้ไปที่ธุรกรรมและส่งออกรายงาน ปิดผลลัพธ์และกลับไปที่ Reportbuilder ขั้นตอนนี้มีแนวโน้มที่จะทริกเกอร์การแสดงตัวอย่าง
  • ลากเขตข้อมูลที่ใดก็ได้ไปยังส่วนที่เกี่ยวข้อง และใช้บล็อกเค้าโครงทางด้านซ้ายเพื่อพิมพ์พิกัดจริง แทนที่จะพยายามวางตําแหน่งและจัดตําแหน่งเขตข้อมูลด้วยสายตา วิธีนี้ยังช่วยให้คุณประสานความสูงและความกว้างของฟิลด์ได้อีกด้วย
  • หลังจากลากเขตข้อมูลไปยังส่วนแล้ว ให้คลิกที่ใดก็ได้ในส่วนนั้น สิ่งนี้จะแบ่งป้ายชื่อและฟิลด์ออกเป็นสองส่วน ซึ่งทําให้ง่ายต่อการลบส่วนป้ายชื่อ
  • แทนที่จะดับเบิลคลิกที่ป้ายกํากับ คุณยังสามารถป้อนคําบรรยายในส่วน ข้อความ ทางด้านซ้ายได้อีกด้วย
  • หากต้องการเริ่มต้นใหม่ เพียงสร้างฟอร์มใหม่และบันทึกไว้บนฟอร์มที่มีอยู่

วิธีคัดลอกเทมเพลต

  • การคัดลอกเทมเพลตนั้นง่ายกว่าการสร้างเทมเพลตใหม่ตั้งแต่เริ่มต้น เนื่องจากฟิลด์ส่วนใหญ่มีอยู่แล้ว คุณต้องแก้ไขเท่านั้น
  • การคัดลอกแบบฟอร์มยังช่วยให้มั่นใจได้ถึงความสอดคล้องกันเนื่องจากเลย์เอาต์ทั้งหมดเป็นไปตามรูปแบบเดียวกัน (เช่น โลโก้ทางด้านซ้าย ที่อยู่ทางด้านขวา)
  1. สร้างเท็มเพลตใน BOS เพื่อให้ชื่อของฟอร์มถูกสร้างขึ้นผ่านโมดูล ชนิดธุรกรรม หรือ เท็มเพลตเอาต์พุต
  2. Open a Transaction list (e.g. Main Menu > Workflow > Quotations).
    • หมายเหตุ คุณไม่สามารถสร้างฟอร์มก่อนที่จะป้อนข้อมูล เนื่องจากเขตข้อมูลจะถูกสร้างขึ้นเมื่อมีการป้อนข้อมูลเท่านั้น
    • หมายเหตุ ฟิลด์ข้อมูลที่พร้อมใช้งานในตัว ออกแบบฟอร์ม จะถูกสร้างขึ้นจากมุมมองที่เปิดอยู่บนหน้าจอ
  3. คลิก เมนู>หลัก เปิดไฟล์ > และเลือกเทมเพลตจากรายการ (หรือเมนู>หลัก โหลดไฟล์>จากไฟล์ เพื่อเปิดรายงานที่สร้างขึ้นที่อื่น)
  4. คลิก เปิด (ปุ่ม)
  5. ถ้าคุณได้รับข้อความ เทมเพลตการอ่านผิดพลาด ให้คลิก ละเว้นทั้งหมด และ เชื่อมโยงเทมเพลตอีกครั้ง เมื่อโหลดแล้ว
  6. บันทึกเทมเพลตก่อนเปลี่ยน: คลิก เมนู > หลัก บันทึกไฟล์ > เป็น และเลือกตัวเลือกในรายการ (ชื่อที่คุณสร้างขึ้นในขั้นตอนที่ 1) คลิก บันทึก (ปุ่ม).
  7. ทําการเปลี่ยนแปลงตามความจําเป็น:
    1. เพิ่มฟิลด์ตามต้องการ
    2. คลิกฟิลด์แล้วกด Delete บนแป้นพิมพ์เพื่อลบออก
    3. คลิกเขตข้อมูลแล้วลากเพื่อจัดตําแหน่งใหม่
    4. คลิกเขตข้อมูลและใช้จุดเพื่อปรับขนาด
    5. ดับเบิลคลิกที่เขตข้อมูลข้อความเพื่อเปลี่ยนข้อความ
  8. อย่าลืมบันทึกงานของคุณบ่อยๆ เพราะไม่มีคุณสมบัติการบันทึกอัตโนมัติ (กด Ctrl S)

วิธีเชื่อมโยงเทมเพลตใหม่

  • เมื่อคุณได้รับข้อความ เทมเพลตการอ่านข้อผิดพลาด มักจะหมายความว่าเทมเพลตกําลังค้นหาเขตข้อมูลที่ไม่ได้อยู่ใน QuickEasy BOS รุ่นปัจจุบันของคุณ ส่วนใหญ่จะเกิดขึ้นเมื่อคุณนําเข้าแม่แบบจากฐานข้อมูลอื่น
  • ในกรณีนั้น คุณต้องเชื่อมโยงเขตข้อมูลกับเขตข้อมูลปัจจุบันของคุณอีกครั้ง
  1. คลิกเขตข้อมูลที่คุณต้องการเปลี่ยนแปลง
  2. ที่ด้านบน (ด้านล่างแถวไอคอน) รายการของฟิลด์จะเปิดขึ้น
    1. จากรายการดรอปดาวน์ในบล็อกแรก ให้เลือก ตารางข้อมูล
    2. จากรายการดรอปดาวน์ในบล็อกที่สอง ให้เลือก ฟิลด์
  3. ทําซ้ํา ขั้นตอนที่ 1-2 จนกว่าฟิลด์ทั้งหมดจะถูกเชื่อมโยงใหม่
  4. บันทึก ฟอร์ม (เมนู > หลัก บันทึกไฟล์ > หรือ Ctrl S)

วิธีเปลี่ยนการตั้งค่าการพิมพ์

  1. คลิกไอคอนถัดจากแผนผังรายงานเพื่อเปลี่ยนแผงด้านซ้ายเป็นมุมมองรายงาน
  2. ใน เค้าโครง (แท็บ) ทางด้านซ้าย ให้คลิก + ถัดจาก PrinterSetup เพื่อขยายมุมมอง
  3. เลือกเครื่องพิมพ์ที่อยู่ถัดจาก ชื่อเครื่องพิมพ์ จากรายการดรอปดาวน์ของเครื่องพิมพ์ทั้งหมดที่คุณติดตั้งไว้
  4. เปลี่ยนการตั้งค่าอื่นๆ ตามความจําเป็น
  5. คลิก บันทึกไฟล์>เมนู>หลัก

เกี่ยวกับไปป์ไลน์ข้อมูล

  • ข้อมูลทั้งหมดอยู่ใน DtmdlOutput
  • แต่ละฟิลด์ภายใต้ DtmdlOutput ประกอบด้วยฟิลด์ย่อยหลายฟิลด์
  • หากคุณคลิกฟิลด์ ฟิลด์ย่อยจะแสดงในมุมมองแบบต้นไม้แบบขยายหรือในบล็อกด้านล่าง (ขึ้นอยู่กับการตั้งค่าของคุณ)
  • Each sub-field is linked to its parent field.
    • คุณไม่สามารถใช้เขตข้อมูลย่อยโดยไม่รวมเขตข้อมูลหลักได้ เนื่องจากฟอร์มต้องรู้ว่าจะดึงข้อมูลจากที่ใด (จําเป็นต้องมีลิงก์)
    • กฎนี้ยังใช้กับฟิลด์ย่อยของฟิลด์ย่อยด้วย
    • ตัวอย่างเช่น ถ้าคุณต้องการแสดงปริมาณ คุณต้องรวมส่วนหัว (trans_header) เพื่อระบุว่าปริมาณมาจากที่ใด (เช่น ใบเสนอราคา) และฟิลด์ย่อยที่มีปริมาณ (เช่น est_qty) ก่อนที่คุณจะสามารถแสดงปริมาณ (จํานวน) ได้
    • ต้องแทรกข้อมูลลงในฟอร์มโดยใช้ฟิลด์ DBText หรือ DBMemo (อย่าใช้เขตข้อมูล Rich Text เพื่อเข้าถึงไปป์ไลน์เหล่านี้ เนื่องจากเขตข้อมูล Rich Text ไม่ได้สร้างลิงก์ที่จําเป็น)
รูปภาพของแผนผังข้อมูล
เขตข้อมูลตัวสร้างรายงาน

เรียนรู้เพิ่มเติม

  1. มุมมองแก้ไขอีเมล: อธิบายอินเทอร์เฟซที่สามารถสร้างอีเมลได้
  2. มุมมองรายชื่ออีเมล: อธิบายอินเทอร์เฟซที่แสดงรายการอีเมลทั้งหมดที่สร้างขึ้น
  3. เทมเพลตอีเมล: อธิบายอินเทอร์เฟซที่สามารถสร้างเทมเพลตอีเมลได้ แสดงรายการฟิลด์ข้อมูลที่มีอยู่ทั้งหมด
  4. อินเทอร์เฟซตัวออกแบบฟอร์ม: อธิบายคุณลักษณะที่ใช้กันทั่วไปสําหรับตัวออกแบบฟอร์ม
  5. ปุ่มเอาต์พุต: อธิบายปุ่มเอาต์พุตที่พร้อมใช้งานในมุมมองส่วนใหญ่
  6. บทช่วยสอนเทมเพลตเอาต์พุต: บทช่วยสอนเหล่านี้อธิบายวิธีเพิ่มเทมเพลตให้กับชนิดธุรกรรมและโมดูลอื่นๆ
  7. โมดูลเทมเพลตเอาต์พุต: อธิบายอินเทอร์เฟซเทมเพลตเอาต์พุต