
Custom Reports
You can use the Custom Reports module to create, edit, and manage custom reports with accompanying charts. It has a user-friendly interface to define report headers, fields, filters, and drilldown options, enabling tailored data analysis and reporting.
Creating customised reports for customers is one of the services QuickEasy offers.
Custom reports include two interfaces:
- Edit Reports: Reports are created or edited using SQL. Edit Reports can be found in the Setup menu.
- Custom Reports: Displays the created reports. Custom reports can be added to any Menu Group as a whole or as individual reports. When added as a group, users select reports to display from a dropdown list. This list only contains reports they are authorised to view.
Interface
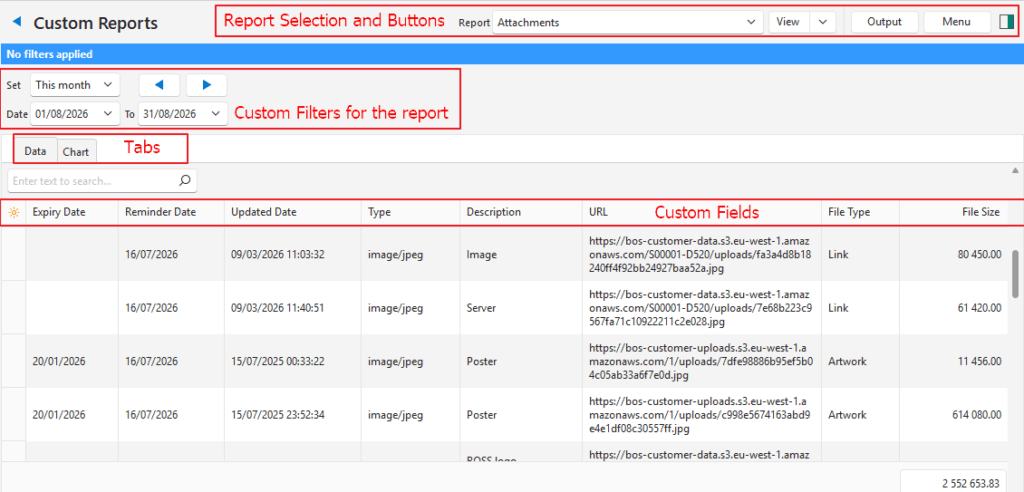
Buttons Explained
Button | Description |
View | Displays the report. Warning: This process is not instant. |
Arrow on View Button | Reset Data Filter: Removes the report and clears the selected report next to the Report filter. |
Output | Prints, previews, or exports the selected report if Output Templates are added. The available pipelines are:
Export xlsx: Allows the report to be saved in .xlsx format. |
Menu |
|
Filters Explained
- The top row provides a dropdown list of all the custom reports the user has access to.
- This filter is only displayed if custom reports were added to a menu. It is not displayed if only a single report was added to a menu.
- Report-specific filters are displayed above the report.
Tabs Explained
- If a chart is enabled the report is divided into two tabs.
- The Data tab displays the report fields.
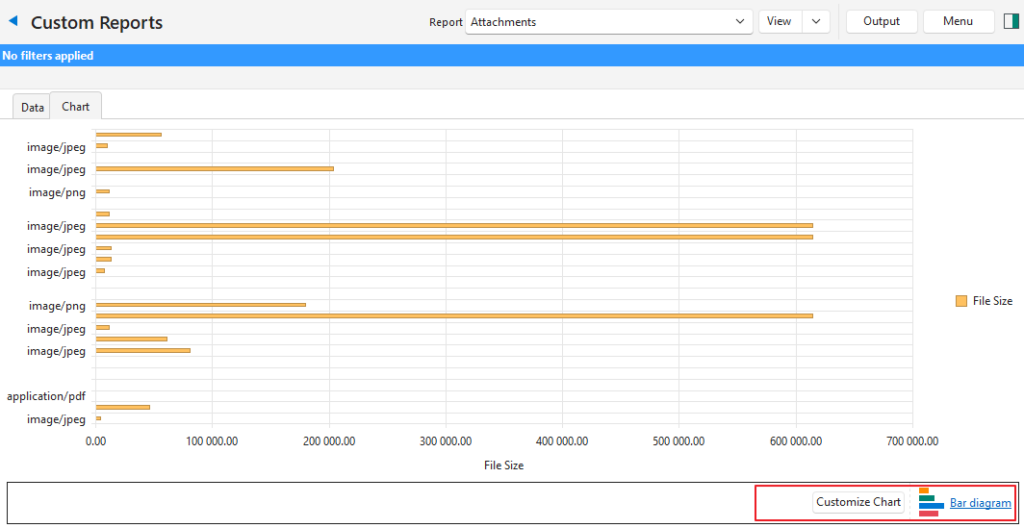
- The Chart tab displays a chart which can be customised.
Fields Explained
- The first column is the standard Field Chooser (*) column that is used to add or remove columns.
- The other columns depend on the chosen report.
- Until a report is chosen, no filters or columns are displayed.
- Negative amounts on the report are displayed in red.
Tutorials
How to Display a Custom Report
- Navigate to Custom Reports.
- Note: The navigation depends on where the module is added in your menu system.
- Select the report you want to view from the dropdown list next to Report.
- Note: If an individual report is added to a Menu Group, there is no dropdown list. The report is automatically selected.
- Click View (button).
How to Customise the Chart
- Navigate to Custom Reports or a specific custom report.
- Select the report you want to view from the dropdown list if applicable.
- Click View (button).
- Click Chart (tab).
- On the bottom there are two buttons:
- Click Customize Chart:
- Check or uncheck fields to hide or show them on the Series Tab.
- Sort by (bottom of the popup): Select a field to sort the chart from the dropdown list.
- Click the name of the chart (e.g. Column diagram):
- Click any of the other diagrams to display the chart in a different format.
- Click Customize Chart:
Troubleshooting: Custom Reports
- Please select a report” Error:
- Ensure a report is selected from the dropdown list before clicking View (button).
- Empty Grid:
- Check the filter settings (e.g. date range or dynamic filters) to ensure they match the available data.
- “No SQL Statement Provided” Error:
- The selected report lacks a valid SQL query. Edit the report to provide a query.
- Amount or Time Worked Showing Zero:
- If a Custom Report was created and the entries were rounded to the nearest integer, amounts or time worked may show as zero.
- Verify if this is happening by exporting the report in .xlsx format (Output (button)) and opening it in Excel. Increase the number of decimal places for the column showing zero values.
- If increasing the number of decimal places solves the problem, edit the report and increase the number of decimal places.
- Custom Report not on Dropdown List:
- If a Custom Report is not showing on the dropdown list, User Access might not have been set for that report.
- If user access has been set, you might not have access to view a particular report – please check with your administrator.
Learn More
- Edit Reports Edit SQL: Explains the interface from which SQL queries can be written for custom reports.
- Edit Reports Formatted Text: Provides examples of formatted text that can be used in custom reports.
- Edit Reports List and Edit Views: Explains the interface from which custom reports are created.
- Edit Reports Tutorials: These tutorials explain how to create custom reports. However, you will need to know how to use SQL to use this module effectively.